
Field Notes
<--2014-01-29 14:30:00 | 2014-04-22 09:00:00-->Other sites visited today: Tonzi | Twitchell Rice | West Pond | Tonzi
Vaira: 2014-02-10 09:00:00 (DOY 41)
Author: Joe Verfaillie
Others: Siyan
Summary: Standard fieldwork, wet and misty, changed Raspberry Pi screen settings.
| Vaira 2014-02-10 I arrived about 9am with Siyan. It was cool, overcast and misty with little to no wind. The recent heavy rain has left big puddles on the road and rivulets in the ruts. The herbs seem to be recovering, but I think many of the grasses have died. Standard fieldwork. I changed the settings on the Raspberry Pi to fixed setting for the screen resolution and refresh rate. I need to double check the setting, because what I remember doesn’t make sense. The screen is model S501BA 1024x768 @ 75Hz. At any rate the screen was working well. There was water on the 7500 windows that I cleaned off, but might accumulate again. |
Field Data
No tank data
Well Depth
| Date | Location | Depth (feet) |
|---|---|---|
| 2014-02-10 | TZ_floor | 32.4 |
| 2014-02-10 | TZ_road | 42.1 |
| 2014-02-10 | TZ_tower | 38.2 |
mode = both
Moisture Point Probes TZ
Array
(
[0] => Tower
[1] => Floor_South
[2] => Floor_East
[3] => Floor_West
[4] => SoilCO2
[5] => Soil_Transect_4
[6] => Soil_Transect_3
[7] => Soil_Transect_2
[8] => Soil_Transect_1
[9] => SoilCO2_West_A
[10] => SoilCO2_West_B
[11] => SoilCO2_West_C
)
| Date | DOY | Rep | Depth | Tower |
Floor_South |
Floor_East |
Floor_West |
SoilCO2 |
Soil_Transect_4 |
Soil_Transect_3 |
Soil_Transect_2 |
Soil_Transect_1 |
SoilCO2_West_A |
SoilCO2_West_B |
SoilCO2_West_C |
Avg | Spacial Count |
Measurement Count |
|---|---|---|---|---|---|---|---|---|---|---|---|---|---|---|---|---|---|---|
| 2014-02-10 | 41 | 0 | 0-15cm | 36.4 | 30.5 | 44.9 | 11.1 | 44.9 | 27.3 | 26.4 | 23.8 | 26.7 | 33.5 | 29.7 | 28.8 | |||
| 2014-02-10 | 41 | 0 | 15-30cm | 35.9 | 40.2 | 36.2 | 26.5 | 33.5 | 42.8 | 31.9 | 34.1 | 16.7 | 27.4 | 34.7 | 36.5 | |||
| 2014-02-10 | 41 | 0 | 30-45cm | 38.5 | 43.8 | 41.9 | 34.9 | 39.4 | 35.7 | 35.4 | 32.4 | 34.1 | 37.1 | 34.1 | 36 | |||
| 2014-02-10 | 41 | 0 | 45-60cm | 41.4 | 43.4 | 52 | 11.1 | 30.5 | 34 | 40.5 | 45.7 | 14.2 | 44 | 50.3 | 48.8 | |||
| 2014-02-10 | 41 | 1 | 0-15cm | 36.7 | 30.2 | 50.2 | 32.4 | 43.1 | 29.7 | 27.6 | 25.6 | 27.6 | 33.2 | 28.8 | 28.5 | |||
| 2014-02-10 | 41 | 1 | 15-30cm | 36.5 | 39.9 | 46.2 | 42.6 | 34.4 | 40.8 | 33.5 | 33.5 | 16.1 | 27.1 | 35.3 | 36.8 | |||
| 2014-02-10 | 41 | 1 | 30-45cm | 37.7 | 43 | 44.9 | 46.5 | 39.4 | 35.4 | 32.9 | 32.7 | 34.1 | 36.8 | 35.4 | 35.7 | |||
| 2014-02-10 | 41 | 1 | 45-60cm | 41.4 | 44.3 | 52.9 | 11.1 | 31.4 | 34.2 | 45.1 | 44.8 | 13.3 | 41.7 | 48.8 | 48.6 | |||
| 2014-02-10 | 41 | 2 | 0-15cm | 31.8 | ||||||||||||||
| 2014-02-10 | 41 | 2 | 15-30cm | 33.8 | ||||||||||||||
| 2014-02-10 | 41 | 2 | 30-45cm | 40.2 | ||||||||||||||
| 2014-02-10 | 41 | 2 | 45-60cm | 11.1 | ||||||||||||||
| 2014-02-10 | 41 | Avg | 0-15cm | 36.55 | 30.35 | 47.55 | 25.1 | 44 | 28.5 | 27 | 24.7 | 27.15 | 33.35 | 29.25 | 28.65 | 31.85 | 12 | 25 |
| 2014-02-10 | 41 | Avg | 15-30cm | 36.2 | 40.05 | 41.2 | 34.3 | 33.95 | 41.8 | 32.7 | 33.8 | 16.4 | 27.25 | 35 | 36.65 | 34.11 | 12 | 25 |
| 2014-02-10 | 41 | Avg | 30-45cm | 38.1 | 43.4 | 43.4 | 40.53 | 39.4 | 35.55 | 34.15 | 32.55 | 34.1 | 36.95 | 34.75 | 35.85 | 37.39 | 12 | 25 |
| 2014-02-10 | 41 | Avg | 45-60cm | 41.4 | 43.85 | 52.45 | 11.1 | 30.95 | 34.1 | 42.8 | 45.25 | 13.75 | 42.85 | 49.55 | 48.7 | 38.06 | 12 | 25 |
mode = both
Moisture Point Probes VR
Array
(
[0] => Solar_Panels
[1] => Flux_Tower
[2] => Gate
[3] => Biomass_Cage
)
| Date | DOY | Rep | Depth | Solar_Panels |
Flux_Tower |
Gate |
Biomass_Cage |
Avg | Spacial Count |
Measurement Count |
|---|---|---|---|---|---|---|---|---|---|---|
| 2014-02-10 | 41 | 0 | 0-15cm | 33.2 | 29.4 | 20.6 | 11.2 | |||
| 2014-02-10 | 41 | 0 | 15-30cm | 33.2 | 30.7 | 42.5 | 28.6 | |||
| 2014-02-10 | 41 | 0 | 30-45cm | 34.2 | 12.9 | 42.1 | 33.5 | |||
| 2014-02-10 | 41 | 0 | 45-60cm | 43.2 | 31.4 | 30.5 | 32.5 | |||
| 2014-02-10 | 41 | 1 | 0-15cm | 33.2 | 29.1 | 23.5 | 10.6 | |||
| 2014-02-10 | 41 | 1 | 15-30cm | 32.6 | 30.7 | 35.3 | 28.9 | |||
| 2014-02-10 | 41 | 1 | 30-45cm | 32.7 | 12.8 | 39.4 | 32.7 | |||
| 2014-02-10 | 41 | 1 | 45-60cm | 42.8 | 30.5 | 37.7 | 32.8 | |||
| 2014-02-10 | 41 | Avg | 0-15cm | 33.2 | 29.25 | 22.05 | 10.9 | 23.85 | 4 | 8 |
| 2014-02-10 | 41 | Avg | 15-30cm | 32.9 | 30.7 | 38.9 | 28.75 | 32.81 | 4 | 8 |
| 2014-02-10 | 41 | Avg | 30-45cm | 33.45 | 12.85 | 40.75 | 33.1 | 30.04 | 4 | 8 |
| 2014-02-10 | 41 | Avg | 45-60cm | 43 | 30.95 | 34.1 | 32.65 | 35.18 | 4 | 8 |
No TZ grass heigth found
No VR grass heigth found
Tree DBH
| Date | Tag# | Reading (mm) |
|---|
No water potential data found
Biomass VR Grass
| Date | rep | AREA (cm2) | LEAFNO (count) | LEAFAREA (cm2) | Green WETWT (g) | Green DRYWT (g) | Brown WETWT (g) | Brown DRYWT (g) | LAI (m2/m2) |
Green WETWT/AREA (g/m2) |
Green DRYWT/AREA (g/m2) |
Brown WETWT/AREA (g/m2) |
Brown DRYWT/AREA (g/m2) |
|---|---|---|---|---|---|---|---|---|---|---|---|---|---|
| 2014-02-10 | 0 | 400 | 82 | 1.76 | 0.39 | 0.21 | 214.63 | 47.56 | 0 | 0 | |||
| 2014-02-10 | 1 | 400 | 42 | 1.08 | 0.22 | 0.11 | 257.14 | 52.38 | 0 | 0 | |||
| 2014-02-10 | 2 | 400 | 84 | 2.06 | 0.35 | 0.21 | 245.24 | 41.67 | 0 | 0 | |||
| 2014-02-10 | SUM | ||||||||||||
| 2014-02-10 | CNT | 3 | 3 | 3 | 3 | 3 | 3 | 3 | |||||
| 2014-02-10 | AVG | 0.18 | 239 | 47.2 |
No VR OakLeaves Biomass data found
No VR PineNeedles Biomass data found
1 photos found
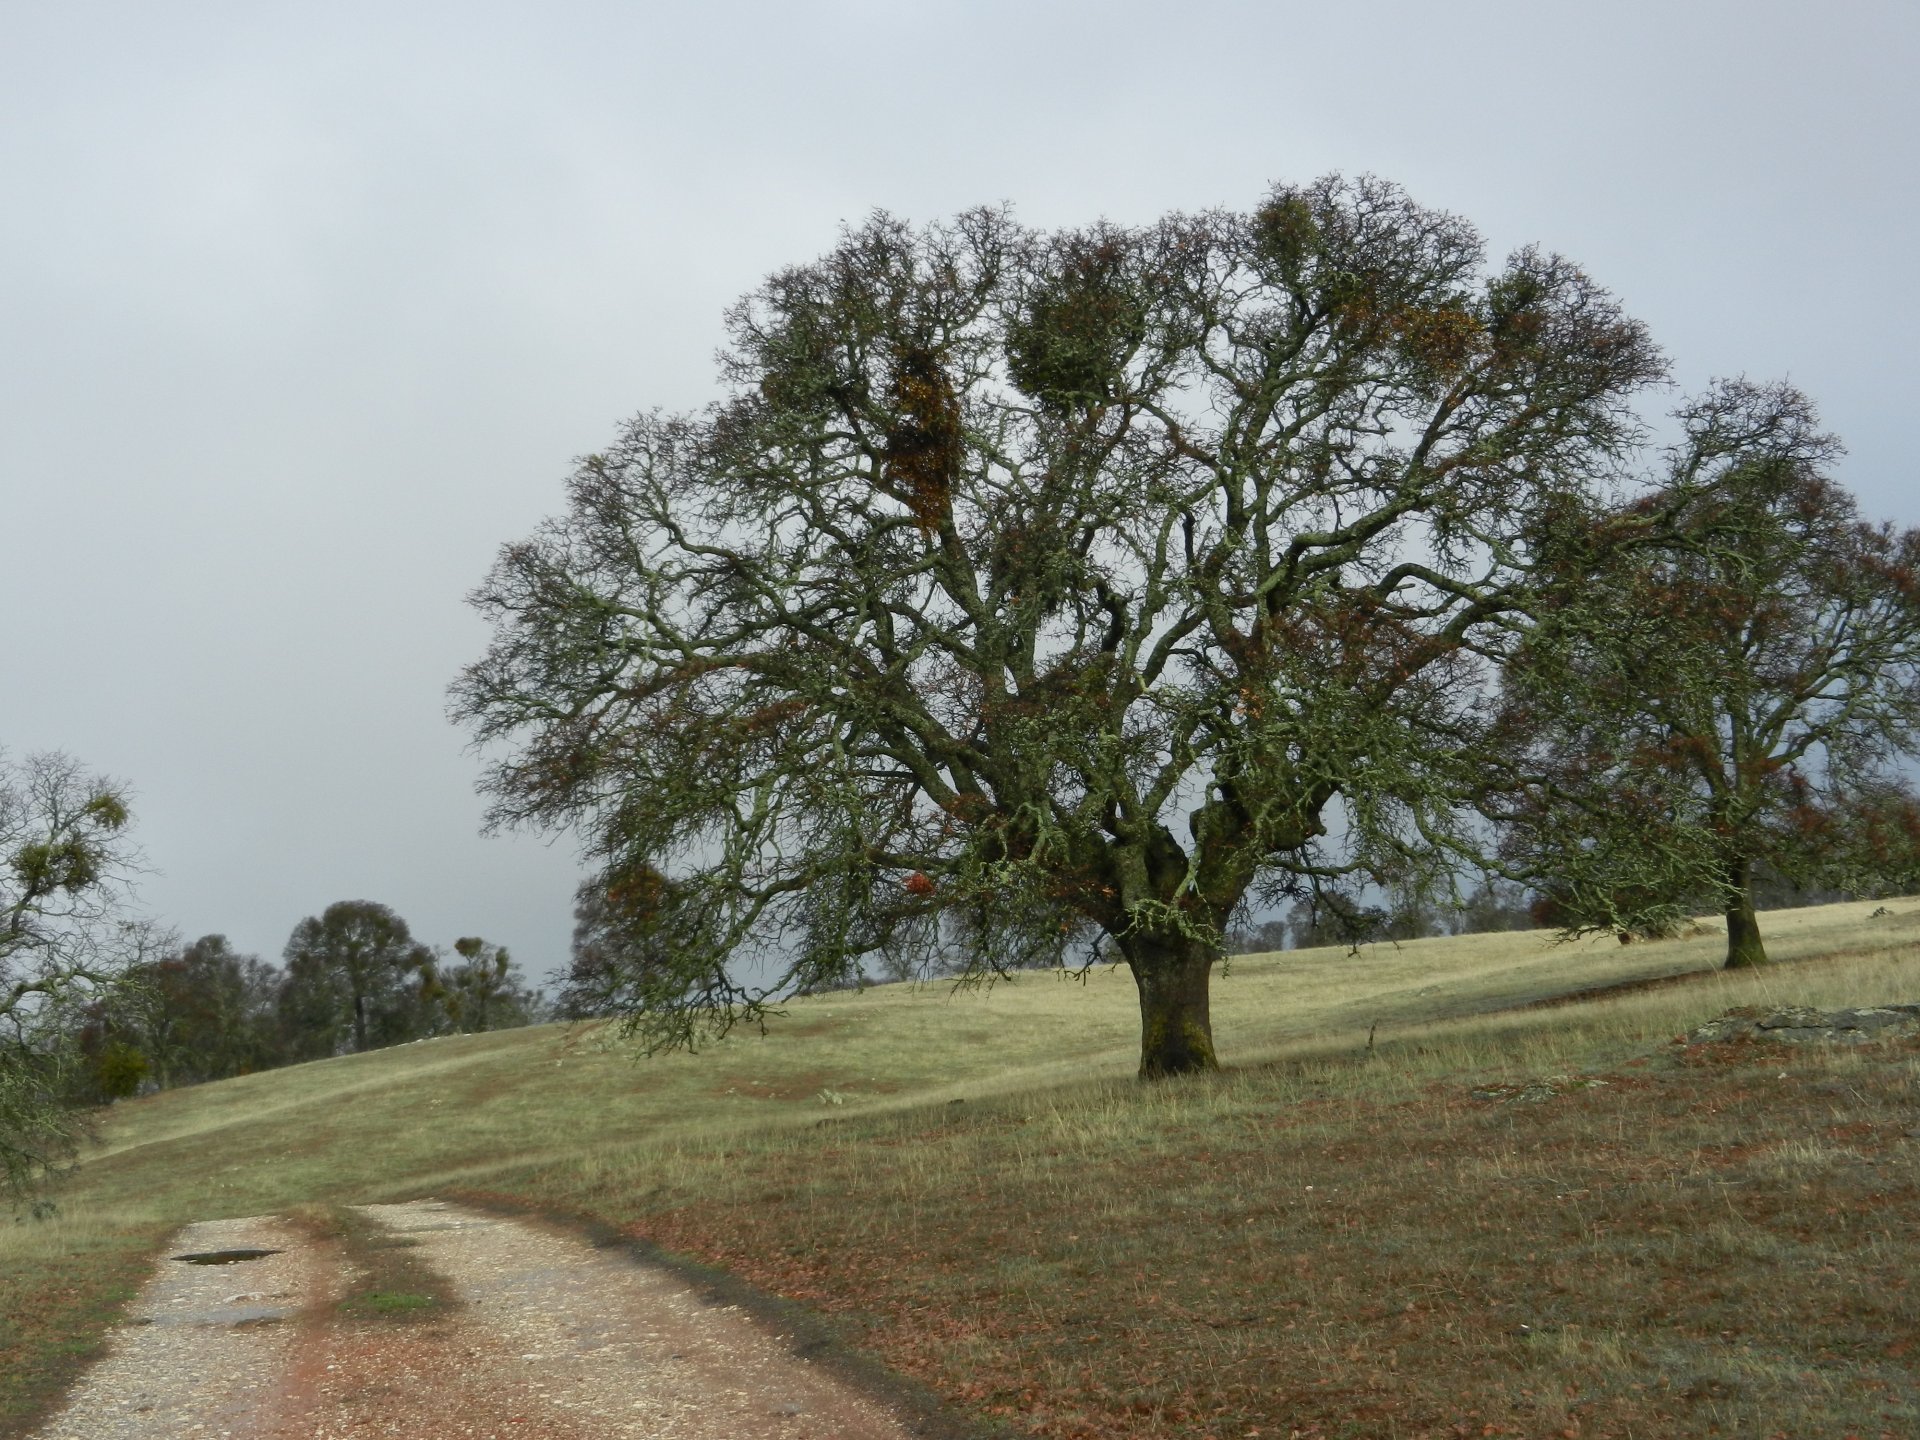
20140210VR_RoadTree.jpg ( 2014-02-10 10:49:59 ) Full size: 1920x1440
view of field site
9 sets found
16 VR_met graphs found
2 VR_flux graphs found
6 VR_soilco2 graphs found
No data found for VR_pond.
Can't check TZVR_mixed
No data found for VR_fd.
No data found for VR_processed.
No data found for VR_arable.
No data found for VR_soilvue.