
Field Notes
<--2024-04-10 09:20:00 | 2024-05-01 14:45:00-->Other sites visited today: Bouldin Corn | Bouldin Alfalfa | Mayberry | Gilbert Tract
Phenocam link: Searching...
Hill Slough: 2024-04-16 10:00:00 (DOY 107)
Author: Joe Verfaillie
Others: Daphne
Summary: Removed redundant water level for temporary use at GT, swapped 7500, standard data collection, lots of birds
| Hill Slough 2024-04-16 Daphne and I arrived at 10:00 PDT. It was mild and still with clear skies and only slight ripples on the water. The water was very brown and there were hella clouds of midges. There were a lot of birds (white pelicans, tundra swans, ducks, herons, etc) out on the water. The reeds to the north and west looked green – no sign of the small bunches near the boardwalks, but the water was pretty high. The staff gauge read 5.5ft at 9:22 PST. I pulled the Meter CTD/Hydros sn H21G200002433 from the channel 23x for use at GT. We have water level and conductivity from the EXO here, but mud is close to the low tide level now so we may be missing the lowest water levels. No change to the program as we hope to put this sensor back soonest. At the tower Daphne swapped the 7500: sn 1594 came off and sn 0035 went on 1594 dirty read: 431ppm CO2, 551mmol/m3 H2O, 19.1C, 102.2kPa, 99SS 1594 clean read: 430ppm CO2, 545mmol/m3 H2O, 18.3C, 102.2kPa, 100SS 0035 new read: 430ppm CO2, 555mmol/m3 H2O, 18.6C, 102.2kPa, 99SS She uploaded the new config file, updated the pressure coefficients, set the clock +2min from 9:17 to 9:19, and restarted logging. I refilled the wash reservoir by half. The 7700 read: 2.05ppm CH4, 37RSSI – 87 after cleaning Daphne collected the flux, met and camera data. We collected salinity samples from the sipper and surface. Porewater, 6.20mS, 19.4C, 1st pull Porewater, 6.12mS, 17.9C, 2nd pull Surface, 2112uS, 17.1C We left at about 10:30 PST |
1 photos found
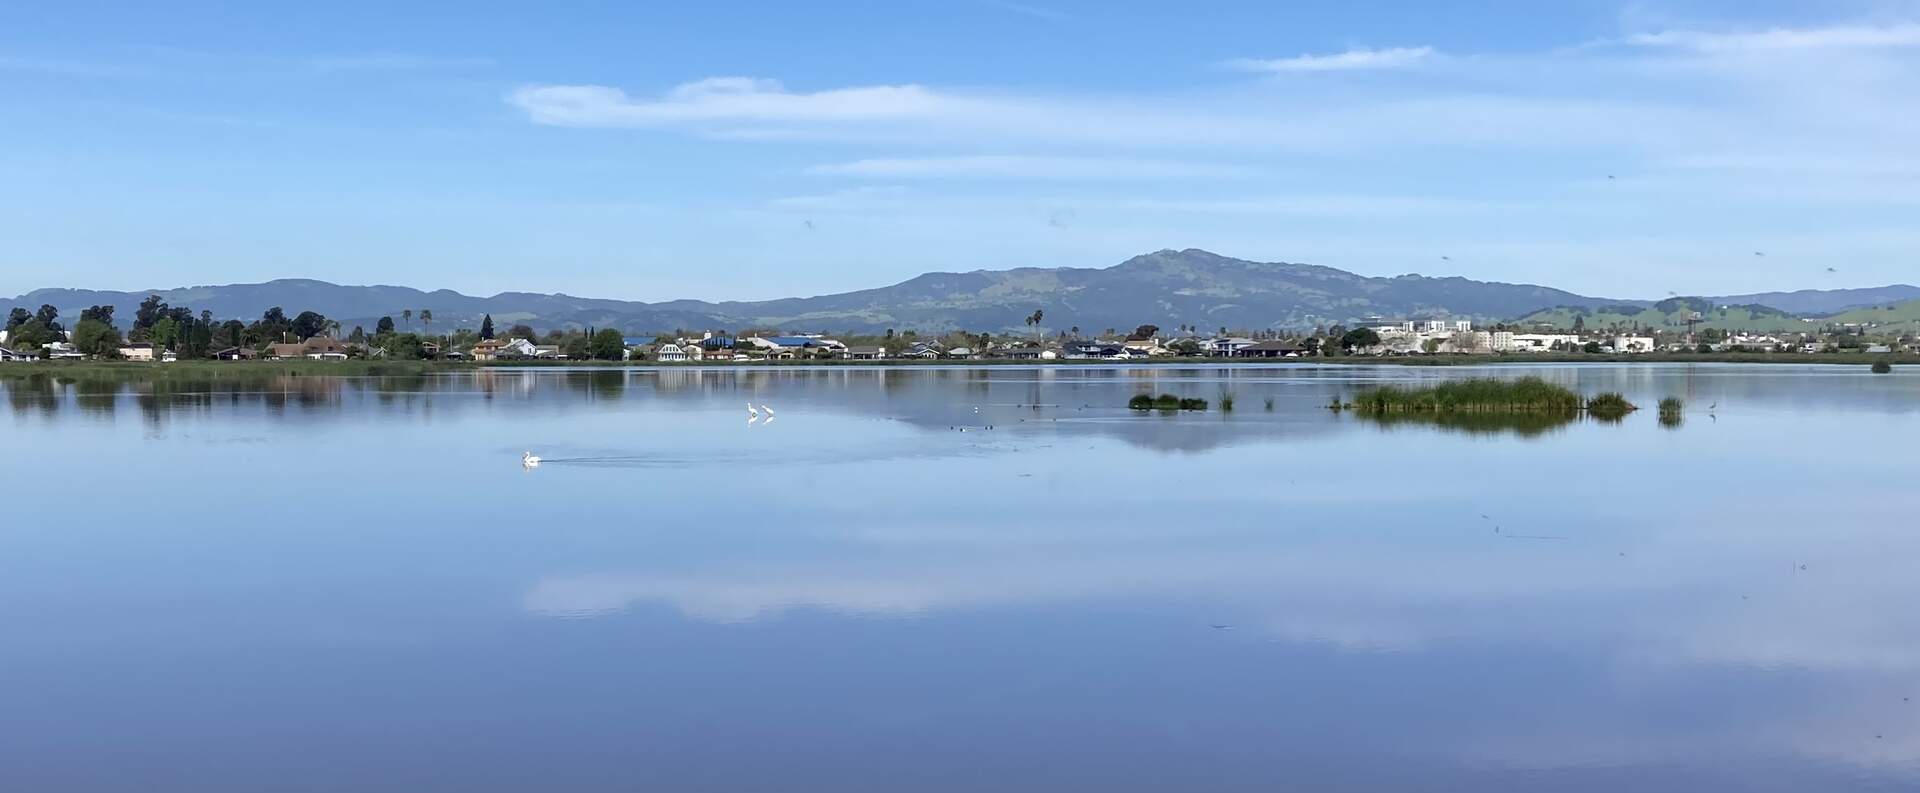
20240416HS_BirdsWaterSky.jpg ( 2024-04-16 10:14:19 ) Full size: 1920x793
A calm day with lots of birds on the water.
4 sets found
21 HS_met graphs found
4 HS_flux graphs found
1 HS_cam graphs found
Can't check HS_Processed
2 HS_Processed graphs found