
Field Notes
<--2024-04-16 13:05:00 | 2024-04-25 10:15:00-->Other sites visited today: Gilbert Tract | East End
Phenocam link: Searching...
Mayberry: 2024-04-23 12:20:00 (DOY 114)
Author: Daphne Szutu
Others: Kyle
Summary: Installed one profile of porewater sippers in the channel, added CTD to floating boom
| 2024-04-23 Mayberry Kyle and I arrived at 12:20 PST (13:20 PDT). It was mostly overcast, cool, and breezy. Goats or sheep were moving the gravel levee road on the west side of Mayberry Slough, between the gas pipeline and our turn off of the gravel levee road. Hopefully they will come through the interior levee roads soon as all of the weeds are very happy. The wetland is still mostly brown. The staff gauge read 30cm. Kyle put on a wetsuit and rubber boots and we got in the channel to install a profile of porewater sippers in the channel. The wetsuit + boot combo worked well for her for installing the sippers because she didn’t have to worry about keeping her elbows/chest above the water. This is the first of three profiles in the unvegetated area. Before installation, she drew surface water through the whole sipper to minimize the amount of air in the sipper. After installation, I pushed in another 60ml of surface water to “develop” the wells and hopefully prevent them from clogging. All of these sippers are fully screened. At one point she dropped the sipper installed in the water, but was able to find it. Kyle had to leave for kid duty, so around 14:00 PDT I drove her back to the Sherman gate, where her car was. I came back at 14:30 PDT to finish the tower work. I downloaded met, cam, USB GHG, and miniDOT data, cleaned flux/rad sensors, and refilled the wash reservoir (it was 80% full). I swapped the miniDOT and Campbell water level sensor. The Campbell water level sensor data was very blocky. It was wired to C7, with both the Campbell VWC sensors. I watched the real-time data and at least half of the measurements were NAN. I also tested the CTD sn H21G200002263. It seemed to work fine IF the Campbell VWC sensors were not connected. I moved both the Campbell water level sensor and the CTD to C5, shared with the dfPAR CR10X. Both of the sensors seemed to work fine, with no NANs, so I decided to leave them in C5. I connected both VWC sensors back to C7. I checked that the CTD, Campbell water level sensor, dfPAR, and both VWC had reasonable data after all of the wiring changes. I installed the CTD on the floating boom, and sent a new CR1000 program and saved the CTD values (depth, temperature, conductivity) with “_boom” in the variable name. The 7500 read: 433ppm CO2, 475mol/m3 H2O, 22.1C, 100.8kPa, 99.8SS – 100 after cleaning The 7700 read: 2.02ppm CH4, 41RSSI – 72 after cleaning The handheld conductivity probe had run out of batteries earlier today during our Los Medanos field trip at Gilbert Tract, so no porewater or surface water conductivity measurements today. I left at 14:55 PST (15:55 PDT). |
2 photos found
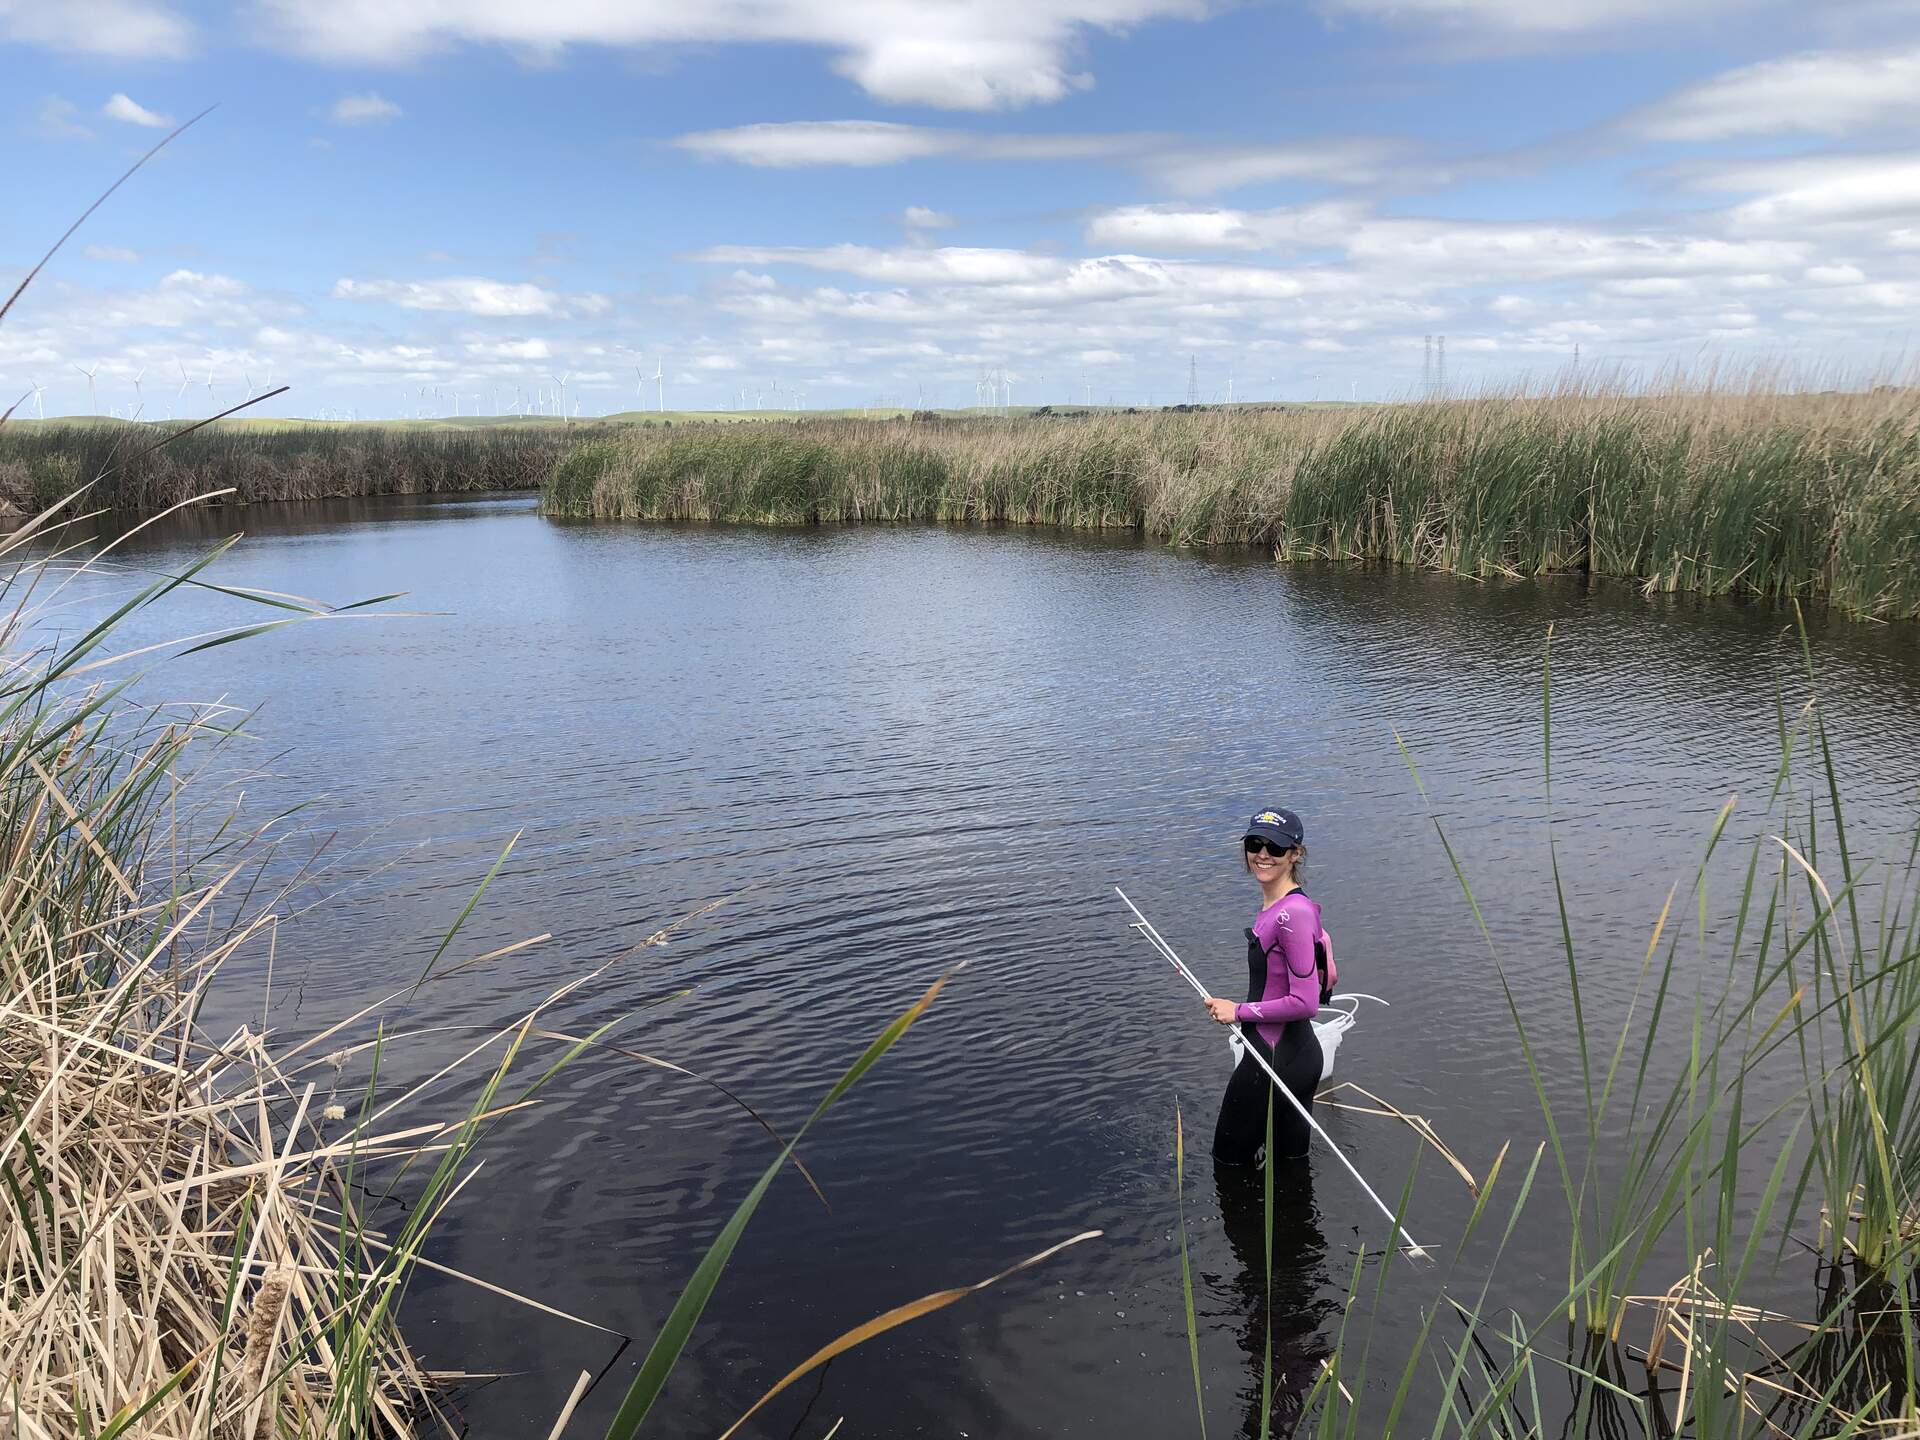
20240423MB_KyleChannel.jpg ( 2024-04-23 13:34:03 ) Full size: 1920x1440
Kyle installing first set of open-water porewater sippers in the Mayberry channel
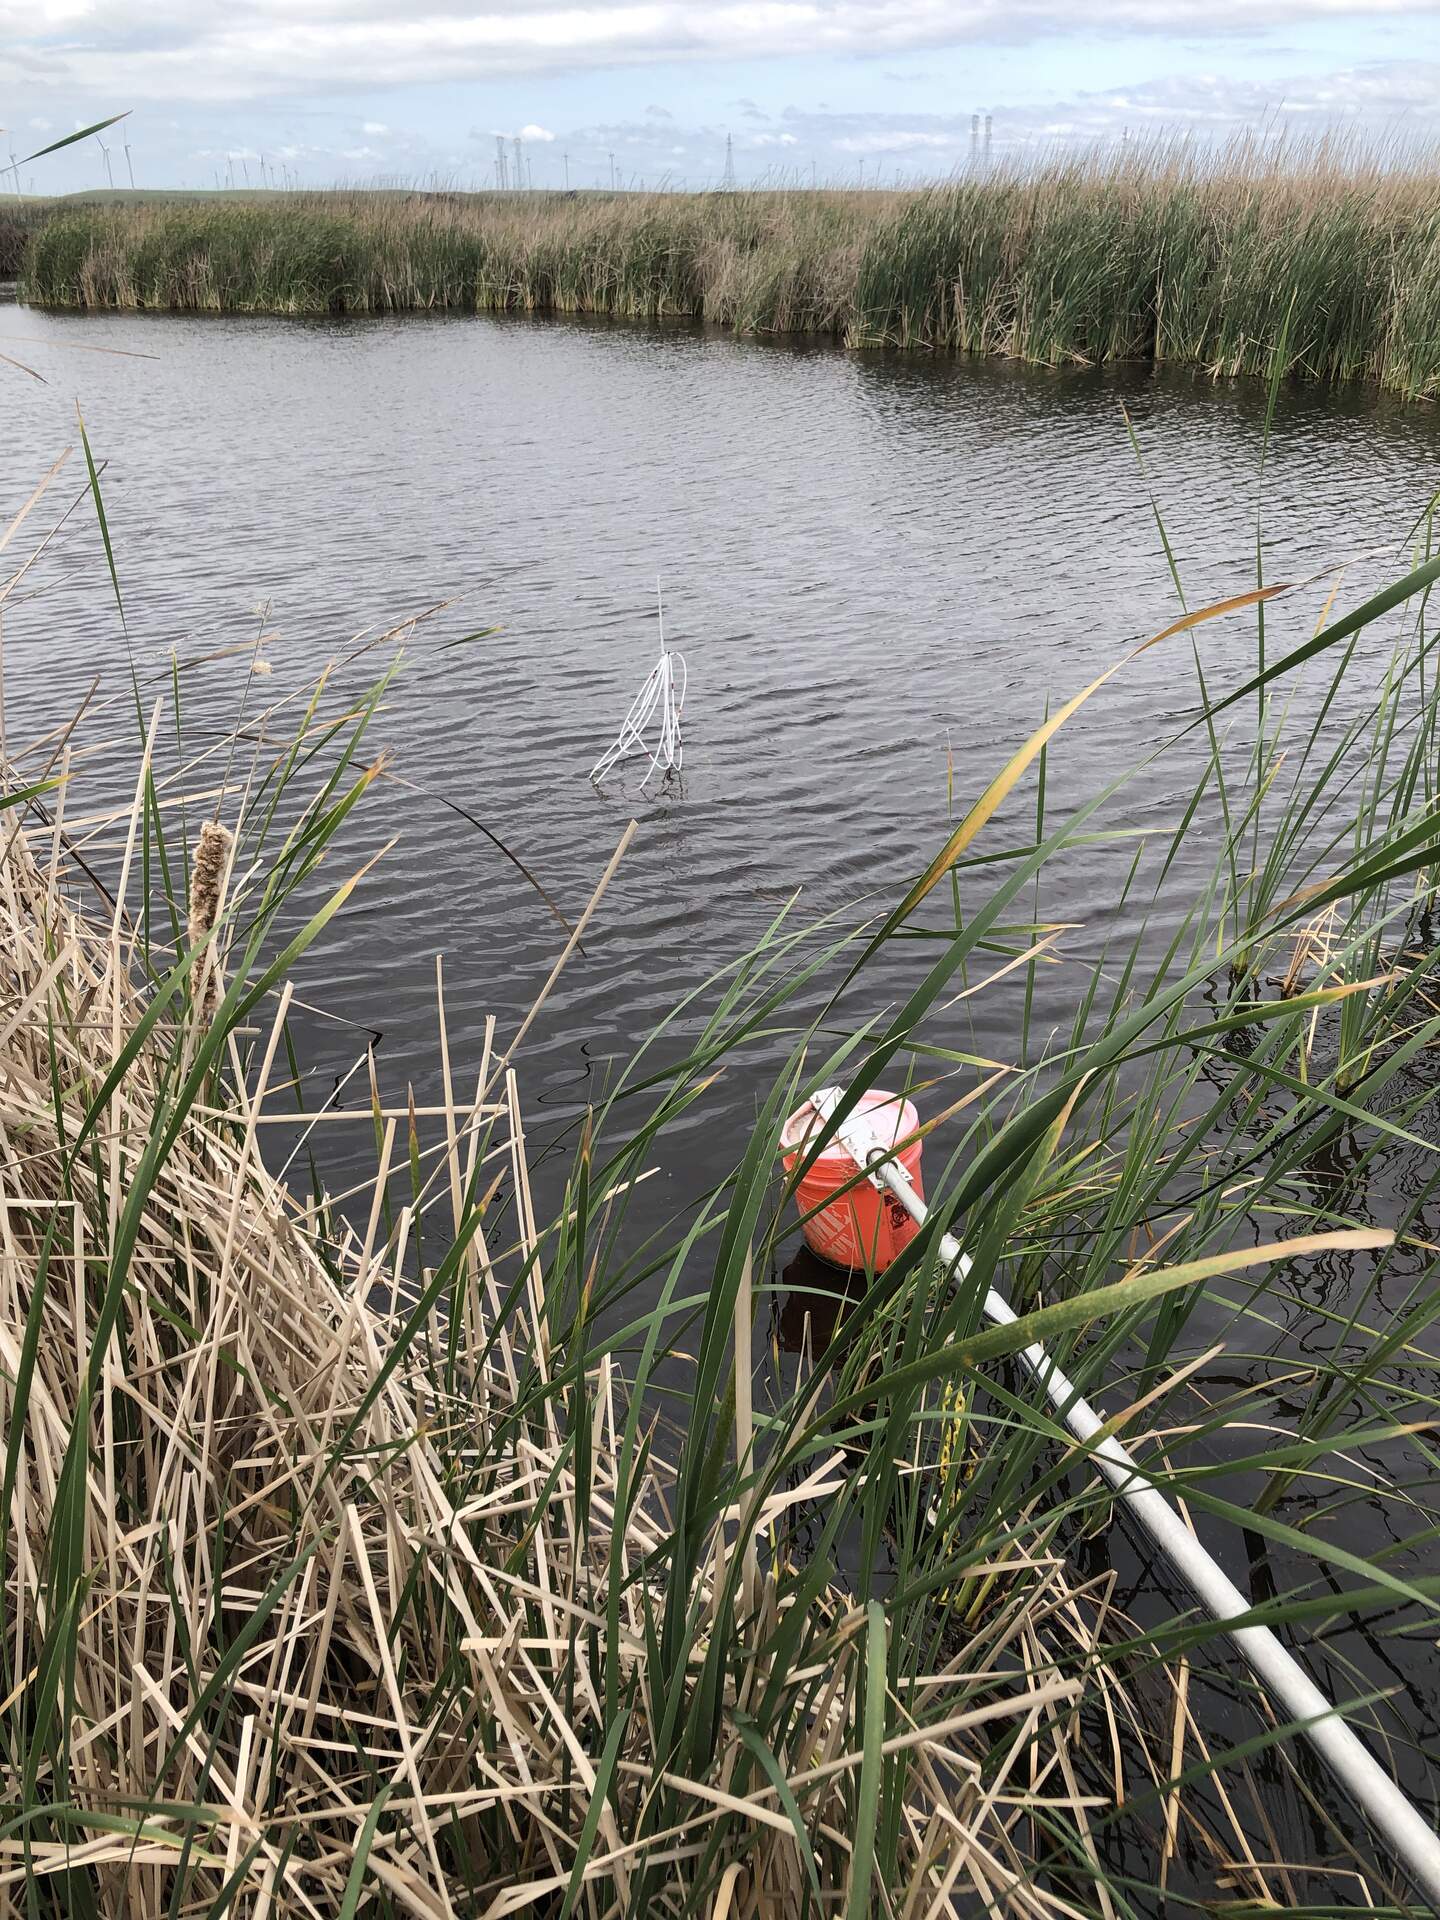
20240423MB_SipperChannel.jpg ( 2024-04-23 15:43:47 ) Full size: 1440x1920
One set of open-water porewater sipper installed in the channel at Mayberry
11 sets found
7 MB_flux graphs found
No data found for MB_met.
28 MB_tule graphs found
Can't check MBWPEESWGT_mixed
1 MB_cam graphs found
Can't check MBEEWPSWEPGT_cam
Can't check SIMBTWEE_met
1 MB_minidot graphs found
Can't check MBSWEEWPBCBA
1 MB_processed graphs found
Can't check MB_fd
1 MB_fd graphs found