
Field Notes
<--2024-04-16 14:15:00 | 2024-05-07 09:10:00-->Other sites visited today: Mayberry | East End
Phenocam link: Searching...
Gilbert Tract: 2024-04-23 08:30:00 (DOY 114)
Author: Daphne Szutu
Others: Dennis, Robert, Kyle, Tyler A., Amanda K., Molly F., Katie B.
Summary: Los Medanos field trip, regular data collection/cleaning
| 2024-04-23 Gilbert Tract It was mostly overcast today with an occasional breeze that picked up throughout the morning. We had sun for about 30 minutes around 9:30 PDT, but other than that it was a very comfortable day, unlike the previous field trip. Today we hosted 4th graders from Los Medanos Elementary School for a field trip from 9:30-12 PDT. There were about 100 students from four different classes. We had 7 science stations. I saw about 2-3 discrete rotations before it more or less became a randomly distributed stream of students coming by. We wrapped up around 11:30 and the students ate lunch sitting on the ground by the tower. It's a challenge for the rotations to be organized because the channel station is so far away from the tower. Joe recommended having two "walking" stations, one for going to the channel and one for returning to the tower. (1) Water quality with the conductivity sensor, at the channel - Dennis - Had 6 water samples this time: seawater from Dillon Beach, HS, GT, MB, EE, and DI water - Katie also took some students down to the channel to touch the algae and water. They enjoyed throwing mud and gravel into the water. (2) Sensors, at the tower – Daphne -Kids enjoyed holding up the Davis cup anemometer and seeing how the vane and cups moved (3) Cattail/tule/azolla - Kyle - Kyle took the students in small groups out onto the boardwalk to look at the azolla - Kids enjoyed squeezing the cattail catkins and hitting each other with long pieces of tule. (4) Peat soil - Tyler - Brought him some peat soil in a bag from East End as an example (5) Abiotic/biotic factors - Robert - One student asked Robert how many years of school you need to become a scientist (6) Bats! - Amanda K. (UCD) - Amanda brought along several bat specimens that she displayed in the trunk of her hatchback. They have to be protected from light so she covered them with a blanket in between groups of students. (7) Plants - Molly - Shared examples of wild asparagus, native walnut (black walnut?), bristly oxtongue, mule fat, coyote bush, etc. Kyle and I started on regular field work while the students were wrapping up lunch, around 11:00 PST (12:00 PDT). I downloaded met, cam, USB GHG, and miniDOT data. Kyle cleaned flux and rad sensors. The reservoir was 80% full; she refilled it. There were a bunch of small wasps nests under the middle boardwalk and one inside the met box. I knocked them all off. The 7500 read: 420ppm CO2, 470mmol/m3 H2O, 20.2C, 101.4kPa, 103SS—104 after cleaning The 7700 read: 1.99ppm CH4, 44RSSI – 86 after cleaning I forgot to download the bird recorder data—next time. The staff gauge read 35cm at 11:20 PST. We went to the channel to download Flo's data at 11:30 PST. It was near low tide and the submerged aquatic vegetation (upslope from the sensor) was clustered near the water surface. We can plan to rake away the vegetation next time we are here at low tide. I reset the clock, downloaded the data, and restarted data logging. The software throws up a message that says there are many files in the internal storage, which may slow down the software (even though there’s plenty of memory left). Maybe next time I’ll see if I can delete the first 6 months of data or something. We left around 11:40 PST (12:40 PST). Looking at data back in the lab, the miniDOT data ended on 2024-04-19. I'll check this miniDOT next time to see if I left some files behind. |
1 photos found
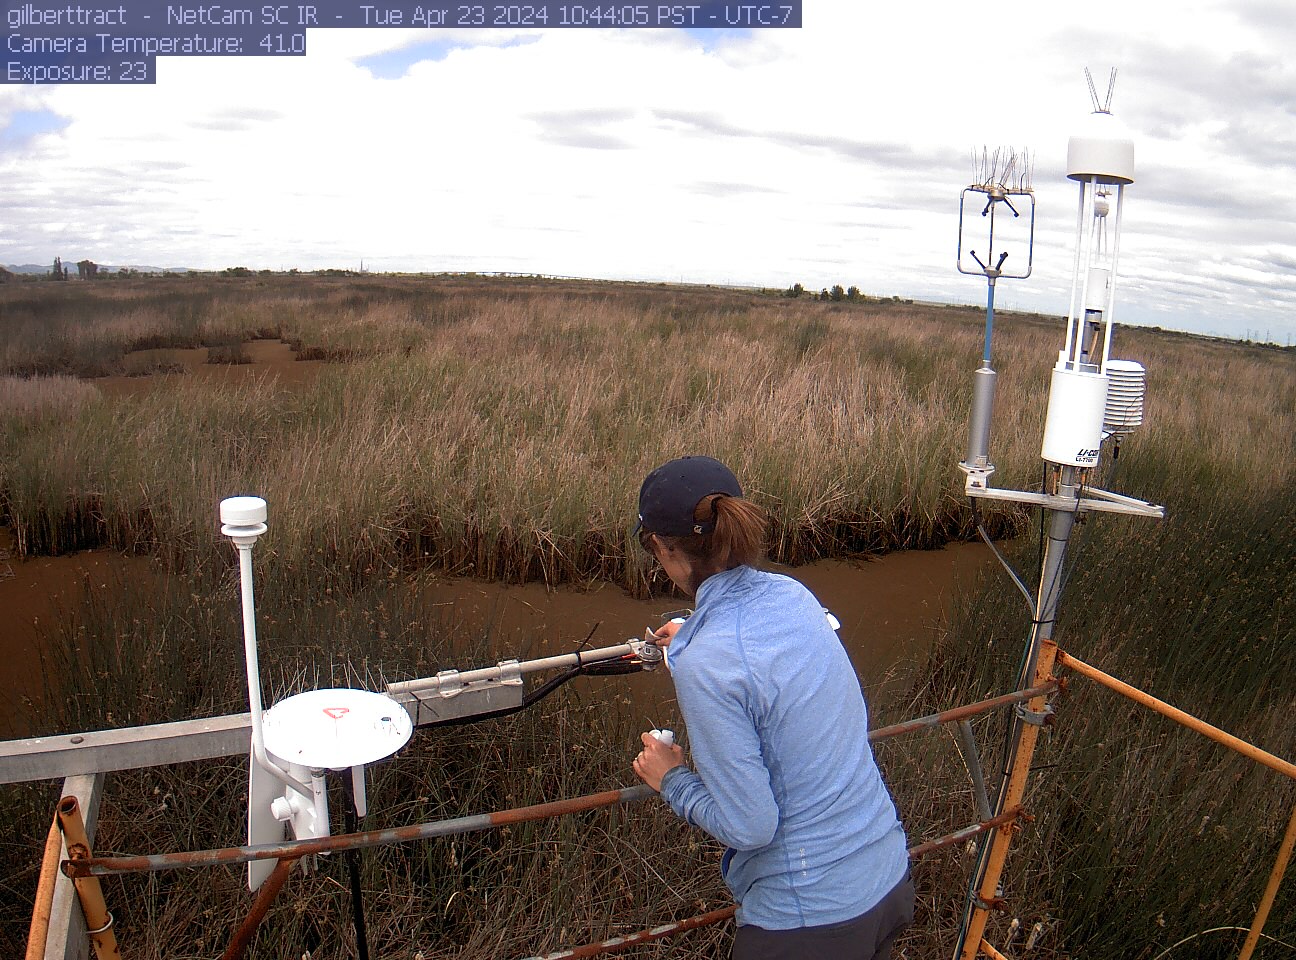
gilberttract_2024_04_23_104405.jpg ( 2024-04-23 19:05:50 ) Full size: 1296x960
Kyle cleaning the radiometers
8 sets found
Can't check MBWPEESWGT_mixed
Can't check MBEEWPSWEPGT_cam
16 GT_met graphs found
4 GT_flux graphs found
3 GT_adcp graphs found
1 GT_cam graphs found
2 GT_usgs graphs found
No data found for GT_chanexo.