
Field Notes
<--2014-02-10 09:00:00 | 2014-05-22 08:15:00-->Other sites visited today: Tonzi | Tonzi
Phenocam link: Searching...
Vaira: 2014-04-22 09:00:00 (DOY 112)
Author: Joe Verfaillie
Others: Siyan
Summary: Standard fieldwork, reset Phenocam clock, cleaned weeds from solar panels.
| Vaira 2014-04-22 I arrived about 9am with Siyan. It was cool and mostly sunny with a nice breeze from the south west. The grass looks much more vigorous than I expected. It is dense and nearly waist high in places. The abundance of wild flowers looks normal. I downloaded data while Siyan did the normal fieldwork. The Phenocam clock was about 10 minutes ahead, I reset it. The CR1000 was about 2min ahead, reset as well. I cleared weeds from the bottom of the solar panels. It still would be nice to get the bottoms out of the dirt. I should bring some boardwalks from Tonzi to boost them up. We returned to Tonzi about 10:30. |
Veg Height (cm): Tape measure from ground to top of plant - Inside fenced area - not grazed
46, 36, 30, 64, 47, 70, 52, 50, 37, avg = 42, stdev = 17.51
Field Data
No tank data
Well Depth
| Date | Location | Depth (feet) |
|---|---|---|
| 2014-04-22 | TZ_floor | 30 |
| 2014-04-22 | TZ_road | 38.2 |
| 2014-04-22 | TZ_tower | 38 |
mode = both
Moisture Point Probes TZ
Array
(
[0] => Tower_1
[1] => Floor_South_1
[2] => Floor_East_1
[3] => SoilCO2_1
[4] => Soil_Transect_4_1
[5] => Soil_Transect_3_1
[6] => Soil_Transect_2_1
[7] => Soil_Transect_1_1
[8] => SoilCO2_West_A_1
[9] => SoilCO2_West_B_1
[10] => SoilCO2_West_C_1
[11] => Tower_2
[12] => Floor_South_2
[13] => Floor_East_2
[14] => Floor_West_2
[15] => SoilCO2_2
[16] => Soil_Transect_4_2
[17] => Soil_Transect_3_2
[18] => Soil_Transect_2_2
[19] => Soil_Transect_1_2
[20] => SoilCO2_West_A_2
[21] => SoilCO2_West_B_2
[22] => SoilCO2_West_C_2
[23] => Tower_3
[24] => Floor_South_3
[25] => Floor_East_3
[26] => Floor_West_3
[27] => SoilCO2_3
[28] => Soil_Transect_4_3
[29] => Soil_Transect_3_3
[30] => Soil_Transect_2_3
[31] => Soil_Transect_1_3
[32] => SoilCO2_West_A_3
[33] => SoilCO2_West_B_3
[34] => SoilCO2_West_C_3
[35] => Tower_4
[36] => Floor_South_4
[37] => Floor_East_4
[38] => SoilCO2_4
[39] => Soil_Transect_4_4
[40] => Soil_Transect_3_4
[41] => Soil_Transect_2_4
[42] => Soil_Transect_1_4
[43] => SoilCO2_West_A_4
[44] => SoilCO2_West_B_4
[45] => SoilCO2_West_C_4
)
| Date | DOY | Rep | Depth | Tower_1 |
Floor_South_1 |
Floor_East_1 |
SoilCO2_1 |
Soil_Transect_4_1 |
Soil_Transect_3_1 |
Soil_Transect_2_1 |
Soil_Transect_1_1 |
SoilCO2_West_A_1 |
SoilCO2_West_B_1 |
SoilCO2_West_C_1 |
Tower_2 |
Floor_South_2 |
Floor_East_2 |
Floor_West_2 |
SoilCO2_2 |
Soil_Transect_4_2 |
Soil_Transect_3_2 |
Soil_Transect_2_2 |
Soil_Transect_1_2 |
SoilCO2_West_A_2 |
SoilCO2_West_B_2 |
SoilCO2_West_C_2 |
Tower_3 |
Floor_South_3 |
Floor_East_3 |
Floor_West_3 |
SoilCO2_3 |
Soil_Transect_4_3 |
Soil_Transect_3_3 |
Soil_Transect_2_3 |
Soil_Transect_1_3 |
SoilCO2_West_A_3 |
SoilCO2_West_B_3 |
SoilCO2_West_C_3 |
Tower_4 |
Floor_South_4 |
Floor_East_4 |
SoilCO2_4 |
Soil_Transect_4_4 |
Soil_Transect_3_4 |
Soil_Transect_2_4 |
Soil_Transect_1_4 |
SoilCO2_West_A_4 |
SoilCO2_West_B_4 |
SoilCO2_West_C_4 |
Avg | Spacial Count |
Measurement Count |
|---|---|---|---|---|---|---|---|---|---|---|---|---|---|---|---|---|---|---|---|---|---|---|---|---|---|---|---|---|---|---|---|---|---|---|---|---|---|---|---|---|---|---|---|---|---|---|---|---|---|---|---|---|
| 2014-04-22 | 112 | 0 | nan | 18.5 | 11.2 | 39.9 | 29.4 | 12.1 | 39.9 | 13.2 | 10.6 | 17.3 | 13.8 | 9.4 | 22.8 | 50 | 21.3 | 24.6 | 26.1 | 17.3 | 34.7 | 24.3 | 10.3 | 18.2 | 4.2 | 23.1 | 32.7 | 36 | 36.8 | 50.2 | 56.9 | 17.6 | 46.6 | 28.8 | 26.2 | 29.9 | 26.5 | 29.9 | 30.2 | 42.8 | 65.5 | 11.1 | 23.6 | 20.5 | 44.8 | 20.5 | 41.7 | 47.4 | 47.1 | |||
| 2014-04-22 | 112 | 1 | nan | 19.7 | 10.4 | 39.9 | 27.1 | 12.4 | 39.9 | 13.8 | 10.3 | 17.1 | 13.8 | 9.7 | 22.5 | 20 | 20.6 | 24.5 | 23.7 | 17.6 | 26.3 | 25.2 | 9.7 | 17.6 | 4.5 | 22.5 | 32.7 | 32.9 | 36.8 | 31 | 44.1 | 17.9 | 29.7 | 28.5 | 26.2 | 29.3 | 27.6 | 29 | 31.9 | 43.7 | 41.4 | 11.1 | 23.6 | 18.8 | 46 | 21.9 | 42 | 46.6 | 48.6 | |||
| 2014-04-22 | 112 | 2 | nan | 39.9 | 30 | 19.1 | ||||||||||||||||||||||||||||||||||||||||||||||
| 2014-04-22 | 112 | Avg | 0-15cm | 0 | 0 | |||||||||||||||||||||||||||||||||||||||||||||||
| 2014-04-22 | 112 | Avg | 15-30cm | 0 | 0 | |||||||||||||||||||||||||||||||||||||||||||||||
| 2014-04-22 | 112 | Avg | 30-45cm | 0 | 0 | |||||||||||||||||||||||||||||||||||||||||||||||
| 2014-04-22 | 112 | Avg | 45-60cm | 0 | 0 |
mode = both
Moisture Point Probes VR
Array
(
[0] => Solar_Panels_1
[1] => Flux_Tower_1
[2] => Gate_1
[3] => Biomass_Cage_1
[4] => Solar_Panels_2
[5] => Flux_Tower_2
[6] => Gate_2
[7] => Biomass_Cage_2
[8] => Solar_Panels_3
[9] => Flux_Tower_3
[10] => Gate_3
[11] => Biomass_Cage_3
[12] => Solar_Panels_4
[13] => Flux_Tower_4
[14] => Gate_4
[15] => Biomass_Cage_4
)
| Date | DOY | Rep | Depth | Solar_Panels_1 |
Flux_Tower_1 |
Gate_1 |
Biomass_Cage_1 |
Solar_Panels_2 |
Flux_Tower_2 |
Gate_2 |
Biomass_Cage_2 |
Solar_Panels_3 |
Flux_Tower_3 |
Gate_3 |
Biomass_Cage_3 |
Solar_Panels_4 |
Flux_Tower_4 |
Gate_4 |
Biomass_Cage_4 |
Avg | Spacial Count |
Measurement Count |
|---|---|---|---|---|---|---|---|---|---|---|---|---|---|---|---|---|---|---|---|---|---|---|
| 2014-04-22 | 112 | 0 | nan | 5.9 | 10 | 27.4 | 2.4 | 15.2 | 13 | 11.8 | 9.7 | 20.1 | 6.4 | 30 | 18.4 | 33.1 | 18.8 | 31.7 | 21.1 | |||
| 2014-04-22 | 112 | 1 | nan | 6.2 | 10 | 26.5 | 2.1 | 15.5 | 13.6 | 11.8 | 9.3 | 19.8 | 5.9 | 30.3 | 18.2 | 33.1 | 18.8 | 31.4 | 20.8 | |||
| 2014-04-22 | 112 | Avg | 0-15cm | 0 | 0 | |||||||||||||||||
| 2014-04-22 | 112 | Avg | 15-30cm | 0 | 0 | |||||||||||||||||
| 2014-04-22 | 112 | Avg | 30-45cm | 0 | 0 | |||||||||||||||||
| 2014-04-22 | 112 | Avg | 45-60cm | 0 | 0 |
Grass Height TZ 16
| Date | Height reps (cm) | Location | Average | Samp | STDEV | |||||||||||||||
|---|---|---|---|---|---|---|---|---|---|---|---|---|---|---|---|---|---|---|---|---|
| 2014-04-22 | 32 | 15 | 24 | 20 | 28 | 19 | 33 | 19 | 13 | 10 | 15 | 12 | 18 | 29 | 25 | 20 | GH_ALL | 20.75 | 16 | 6.89 |
Grass Height VR 9
| Date | Height reps (cm) | Location | Average | Samp | STDEV | ||||||||
|---|---|---|---|---|---|---|---|---|---|---|---|---|---|
| 2014-04-22 | 25 | 18 | 8 | 11 | GH_CLOVER | 15.5 | 4 | 6.58 | |||||
| 2014-04-22 | 46 | 36 | 30 | 64 | 47 | 70 | 52 | 50 | 37 | GH_FENCED | 48 | 9 | 12.27 |
| 2014-04-22 | 52 | 60 | 40 | 60 | 46 | 30 | 58 | GH_OUT | 49.43 | 7 | 10.57 | ||
No VR Tree DBH found
No water potential data found
Biomass VR Grass
| Date | rep | AREA (cm2) | LEAFNO (count) | LEAFAREA (cm2) | Green WETWT (g) | Green DRYWT (g) | Brown WETWT (g) | Brown DRYWT (g) | LAI (m2/m2) |
Green WETWT/AREA (g/m2) |
Green DRYWT/AREA (g/m2) |
Brown WETWT/AREA (g/m2) |
Brown DRYWT/AREA (g/m2) |
|---|---|---|---|---|---|---|---|---|---|---|---|---|---|
| 2014-04-22 | 0 | 400 | 2497 | 144.87 | 33.78 | 6.52 | 2.51 | 6.24 | 580.18 | 135.28 | 26.11 | 10.05 | |
| 2014-04-22 | 1 | 400 | 978 | 51.52 | 13.43 | 2.66 | 1.16 | 2.45 | 526.79 | 137.32 | 27.2 | 11.86 | |
| 2014-04-22 | 2 | 400 | 1685 | 104.02 | 24.21 | 3.88 | 1.58 | 4.21 | 617.33 | 143.68 | 23.03 | 9.38 | |
| 2014-04-22 | 3 | 400 | 2497 | 144.87 | 33.78 | 6.52 | 2.51 | 6.24 | 580.18 | 135.28 | 26.11 | 10.05 | |
| 2014-04-22 | 4 | 400 | 978 | 51.52 | 13.43 | 2.66 | 1.16 | 2.45 | 526.79 | 137.32 | 27.2 | 11.86 | |
| 2014-04-22 | 5 | 400 | 1685 | 104.02 | 24.21 | 3.88 | 1.58 | 4.21 | 617.33 | 143.68 | 23.03 | 9.38 | |
| 2014-04-22 | SUM | ||||||||||||
| 2014-04-22 | CNT | 6 | 6 | 6 | 6 | 6 | 6 | 6 | 6 | 6 | 6 | 6 | |
| 2014-04-22 | AVG | 4.3 | 574.77 | 138.76 | 25.45 | 10.43 |
No VR OakLeaves Biomass data found
No VR PineNeedles Biomass data found
4 photos found
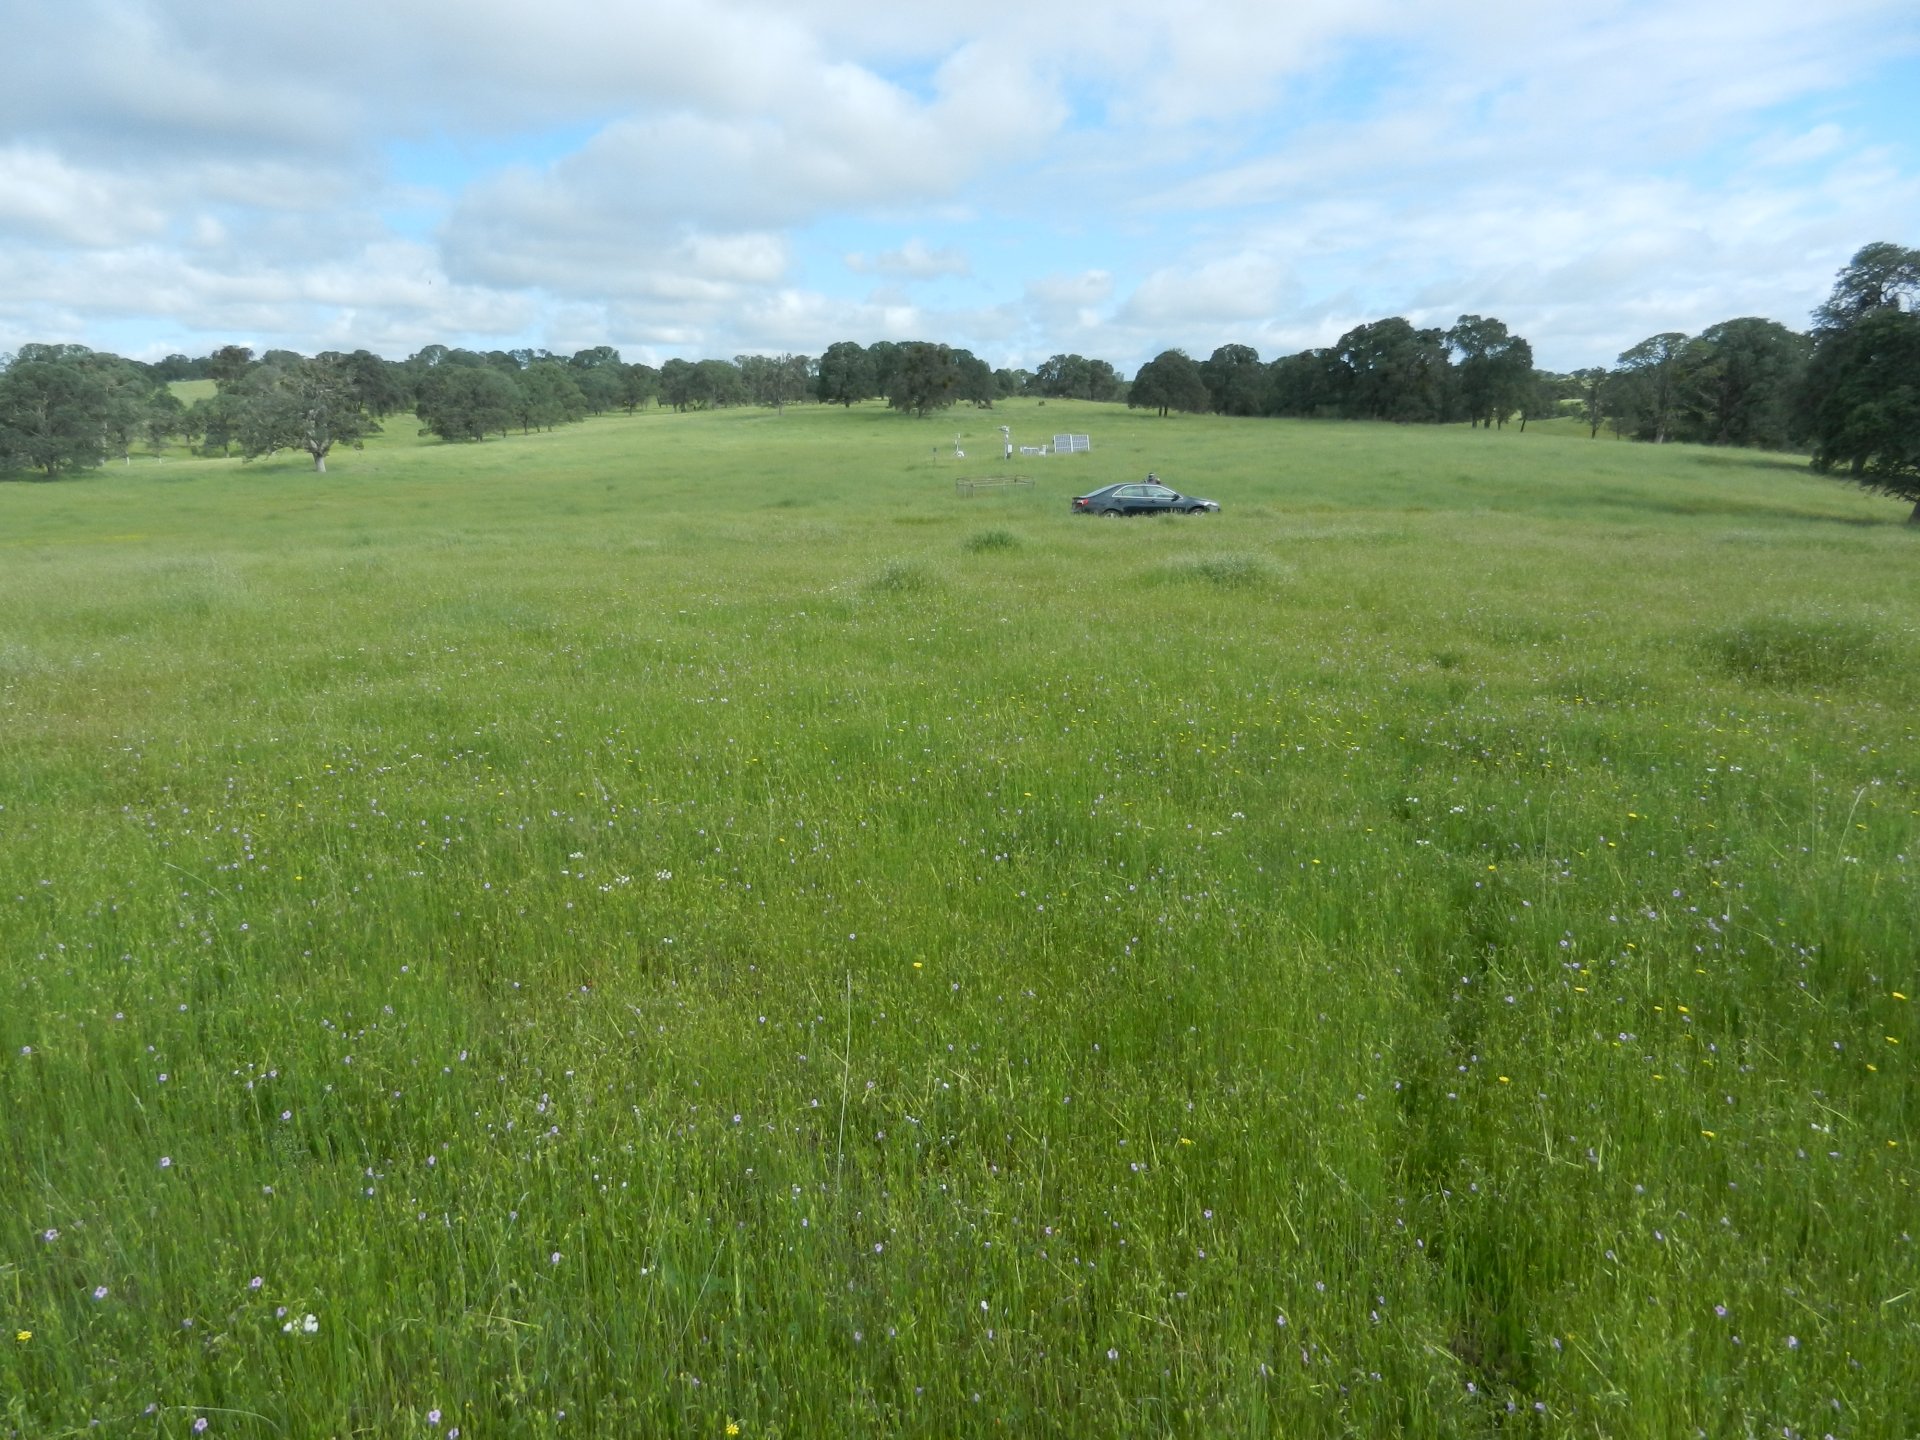
20140422VR_Site.jpg ( 2014-04-22 10:09:00 ) Full size: 1920x1440
Tall green grass at Vaira
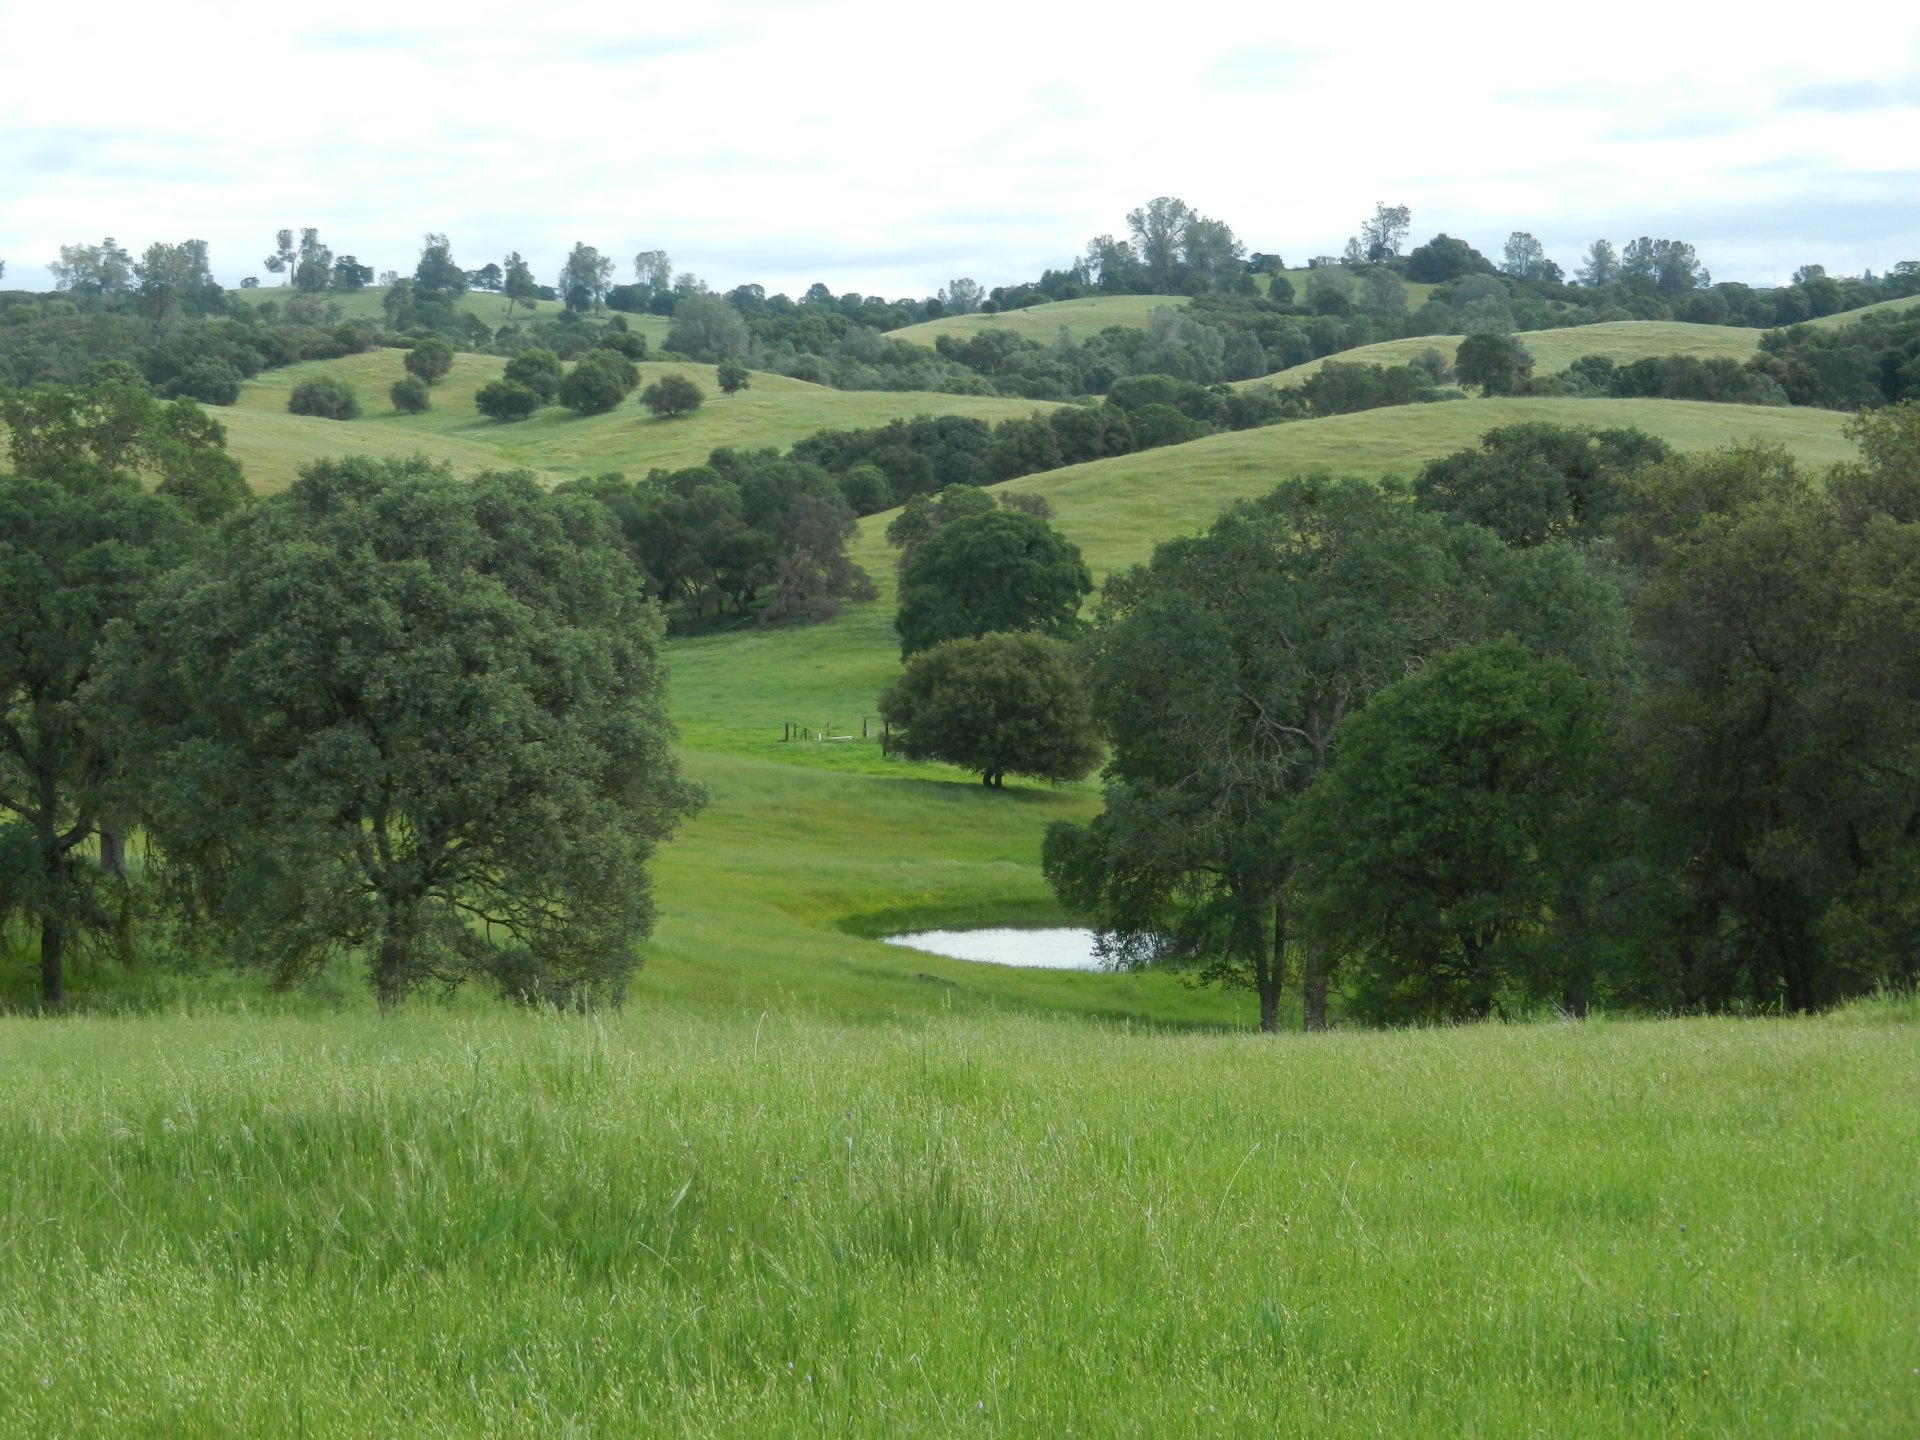
20140422VR_PondAndHills.jpg ( 2014-04-22 10:14:55 ) Full size: 1920x1440
Green oaks, green hills and pond
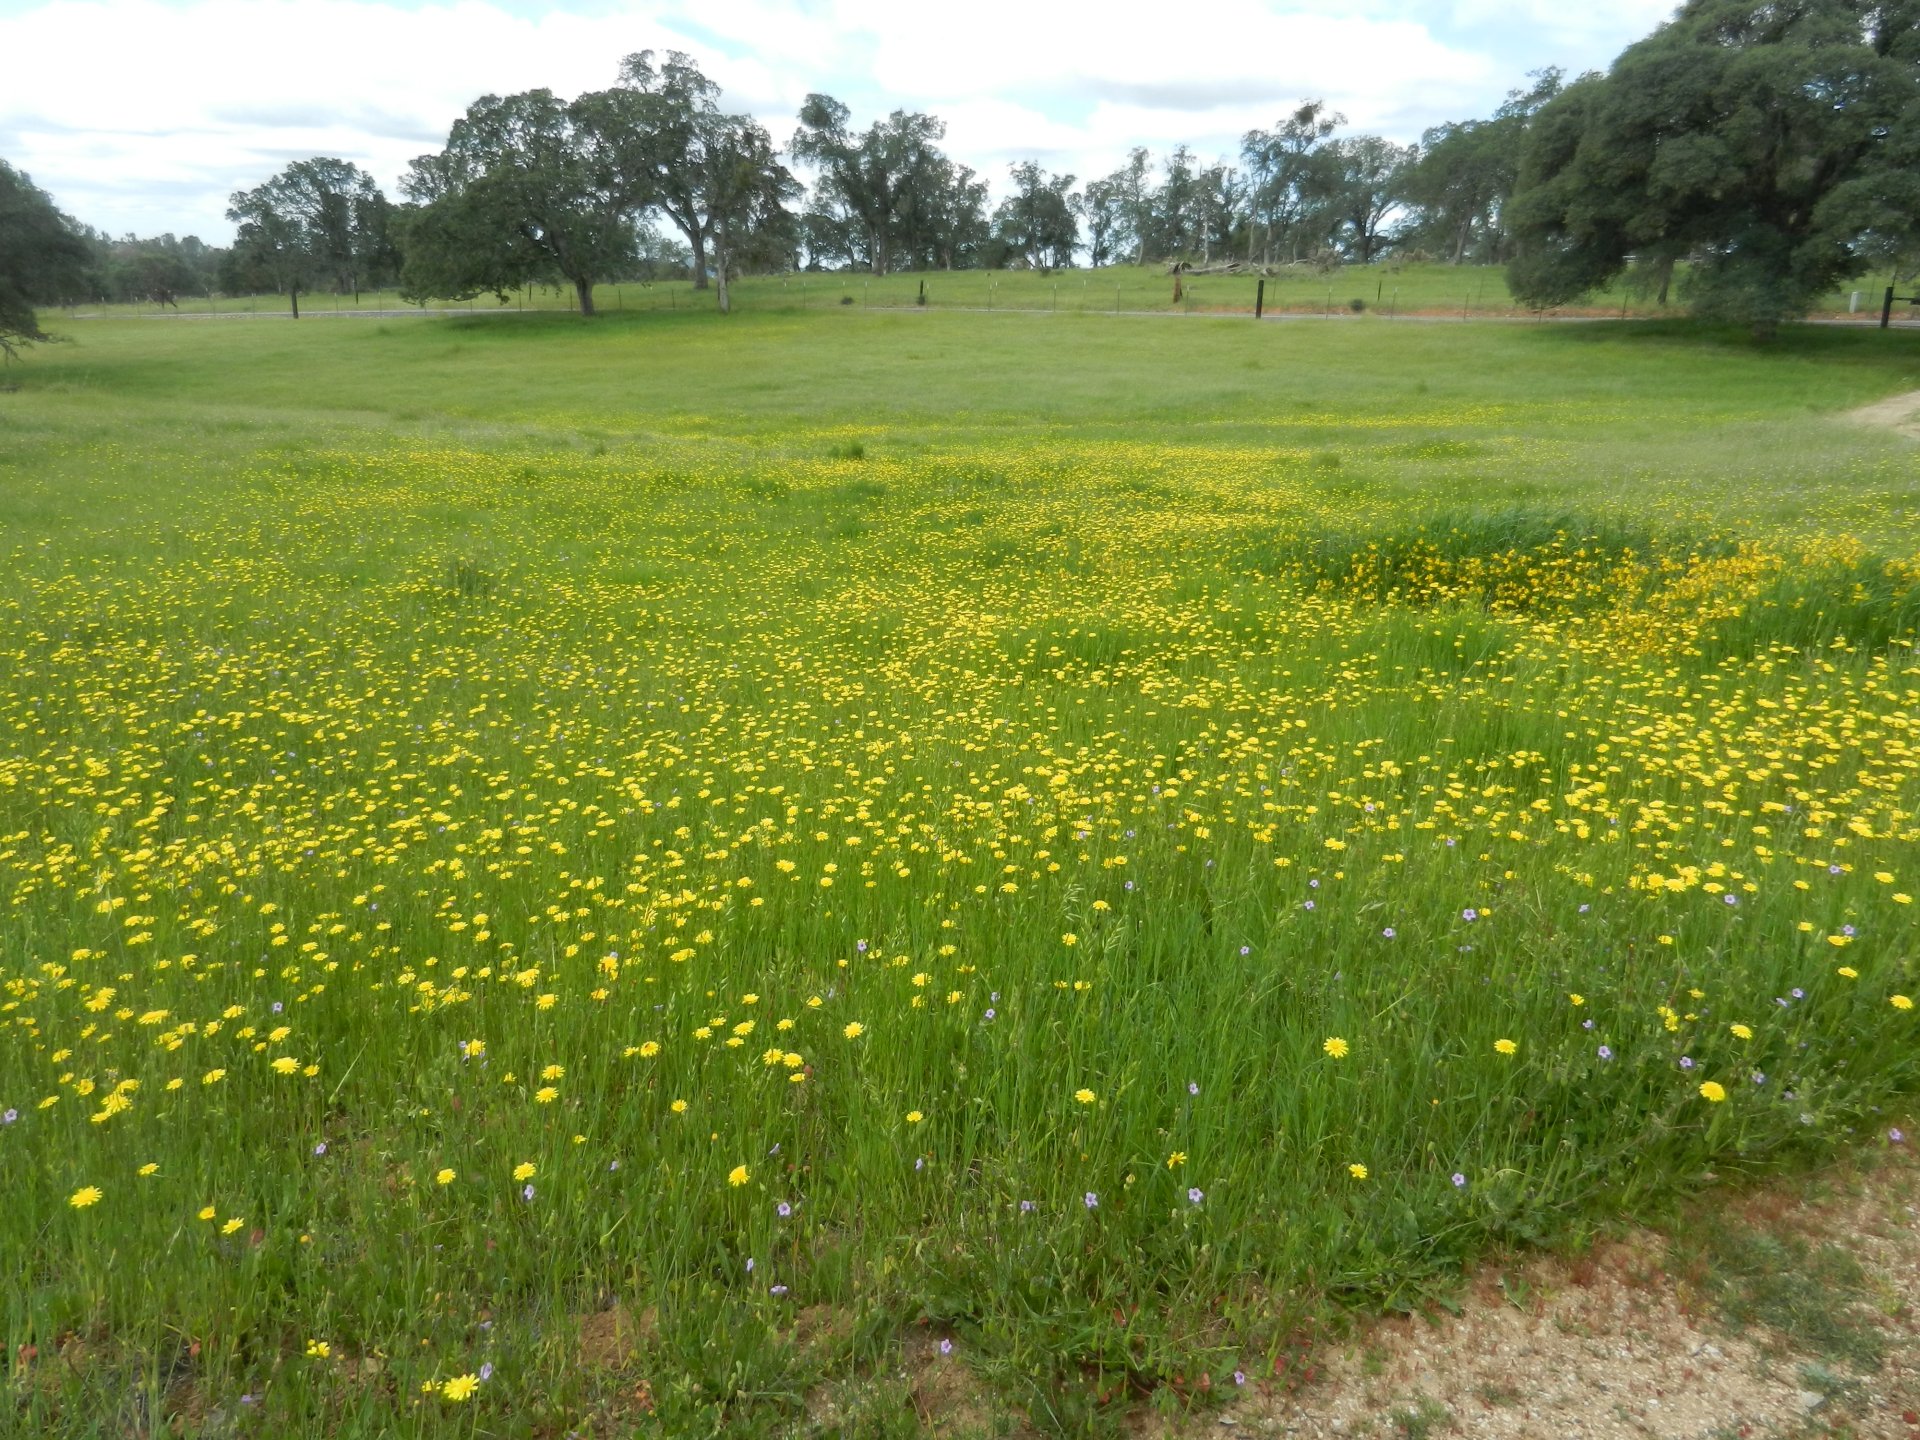
20140422VR_WildFlowers.jpg ( 2014-04-22 10:23:25 ) Full size: 1920x1440
A green field of yellow flowers
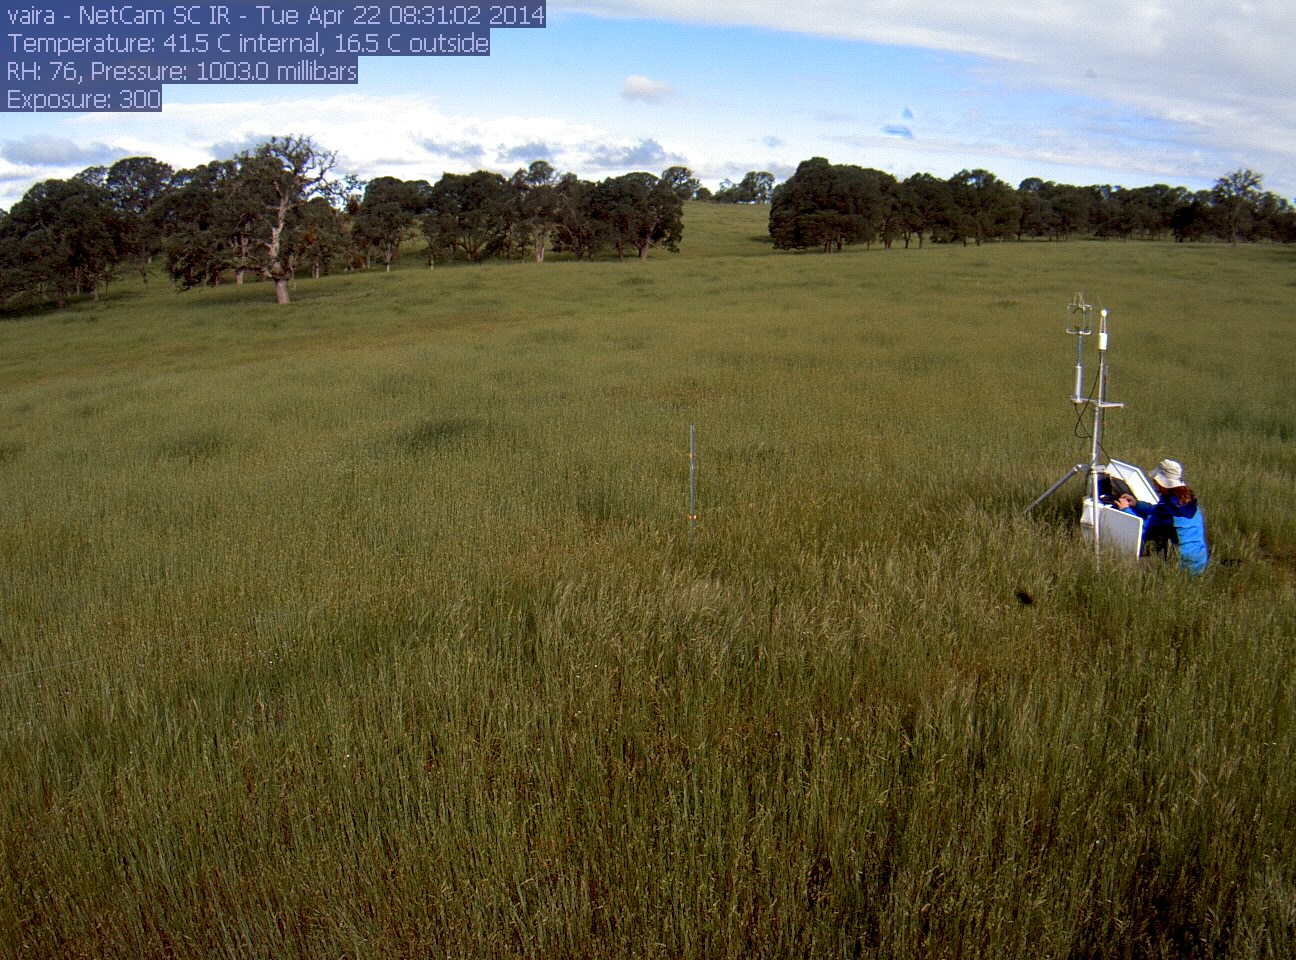
vaira_2014_04_22_083104.jpg ( 2014-04-22 16:24:10 ) Full size: 1296x960
Joe working on the tower in tall grass
9 sets found
16 VR_met graphs found
2 VR_flux graphs found
6 VR_soilco2 graphs found
No data found for VR_pond.
Can't check TZVR_mixed
No data found for VR_fd.
No data found for VR_processed.
No data found for VR_arable.
No data found for VR_soilvue.