
Field Notes
<--2014-01-29 13:00:00 | 2014-02-10 10:00:00-->Other sites visited today: Vaira | Tonzi | Twitchell Rice | West Pond
Phenocam link: Searching...
Tonzi: 2014-02-10 09:00:00 (DOY 41)
Author: Siyan Ma
Others: Joe
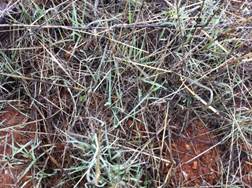
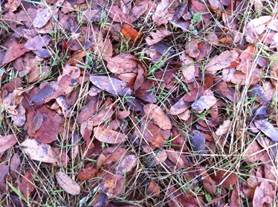
Summary: Standard fieldwork, light rain, ground very wet from recent heavy rain.
|
When: Date: 2/10/2014 , Day: 10 , Watch Time: 9:00 am . Where: Tonzi/Vaira Ranch Who: Siyan, Joe Weather: light rain in the morning, cloudy Phenology: getting wet; Mr. Tonzi’s pond had some water; cows around at Tonzi
Summary
Vaira_Grass Site
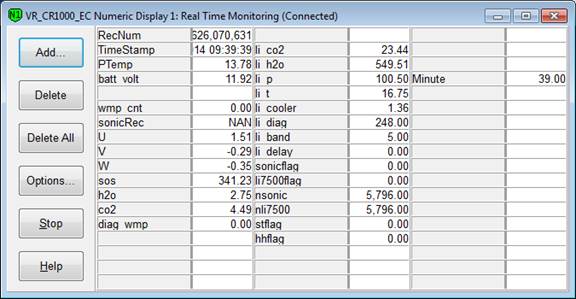
Tonzi_Tower Site
Is the pump running‌ YES!    
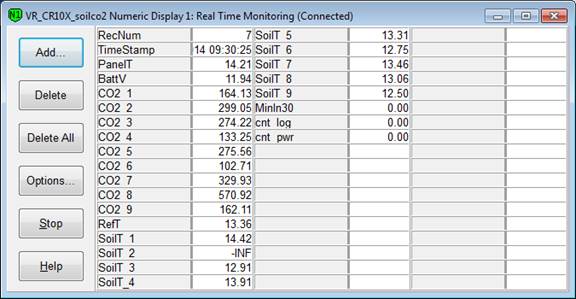
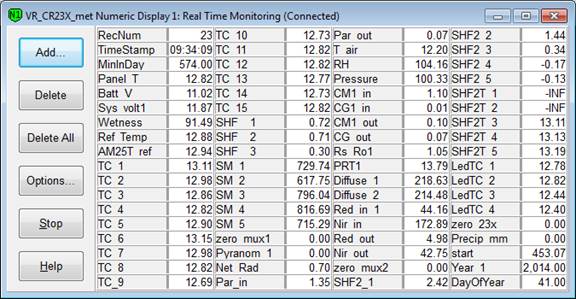
Toniz_Floor Site
CR23X3 – floor-Met CR23X6 – tower-Met CR10X2 – floor-Met Soil CO2 profile: CR23X5 – soil CO2 profile 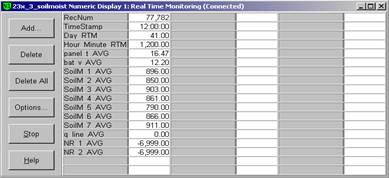 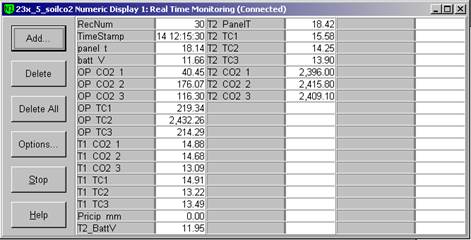 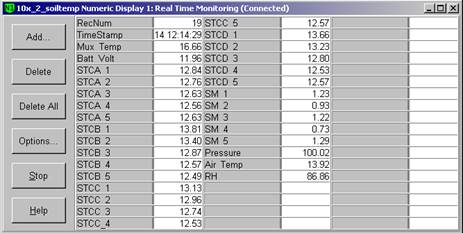 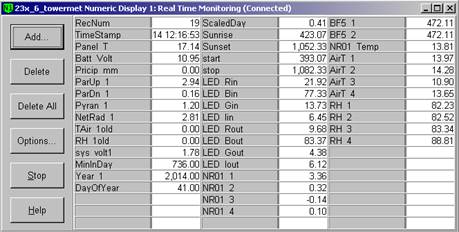
|
Field Data
No tank data
Well Depth
| Date | Location | Depth (feet) |
|---|---|---|
| 2014-02-10 | TZ_floor | 32.4 |
| 2014-02-10 | TZ_road | 42.1 |
| 2014-02-10 | TZ_tower | 38.2 |
mode = both
Moisture Point Probes TZ
Array
(
[0] => Tower_1
[1] => Floor_South_1
[2] => Floor_East_1
[3] => Floor_West_1
[4] => SoilCO2_1
[5] => Soil_Transect_4_1
[6] => Soil_Transect_3_1
[7] => Soil_Transect_2_1
[8] => Soil_Transect_1_1
[9] => SoilCO2_West_A_1
[10] => SoilCO2_West_B_1
[11] => SoilCO2_West_C_1
[12] => Tower_2
[13] => Floor_South_2
[14] => Floor_East_2
[15] => Floor_West_2
[16] => SoilCO2_2
[17] => Soil_Transect_4_2
[18] => Soil_Transect_3_2
[19] => Soil_Transect_2_2
[20] => Soil_Transect_1_2
[21] => SoilCO2_West_A_2
[22] => SoilCO2_West_B_2
[23] => SoilCO2_West_C_2
[24] => Tower_3
[25] => Floor_South_3
[26] => Floor_East_3
[27] => Floor_West_3
[28] => SoilCO2_3
[29] => Soil_Transect_4_3
[30] => Soil_Transect_3_3
[31] => Soil_Transect_2_3
[32] => Soil_Transect_1_3
[33] => SoilCO2_West_A_3
[34] => SoilCO2_West_B_3
[35] => SoilCO2_West_C_3
[36] => Tower_4
[37] => Floor_South_4
[38] => Floor_East_4
[39] => Floor_West_4
[40] => SoilCO2_4
[41] => Soil_Transect_4_4
[42] => Soil_Transect_3_4
[43] => Soil_Transect_2_4
[44] => Soil_Transect_1_4
[45] => SoilCO2_West_A_4
[46] => SoilCO2_West_B_4
[47] => SoilCO2_West_C_4
)
| Date | DOY | Rep | Depth | Tower_1 |
Floor_South_1 |
Floor_East_1 |
Floor_West_1 |
SoilCO2_1 |
Soil_Transect_4_1 |
Soil_Transect_3_1 |
Soil_Transect_2_1 |
Soil_Transect_1_1 |
SoilCO2_West_A_1 |
SoilCO2_West_B_1 |
SoilCO2_West_C_1 |
Tower_2 |
Floor_South_2 |
Floor_East_2 |
Floor_West_2 |
SoilCO2_2 |
Soil_Transect_4_2 |
Soil_Transect_3_2 |
Soil_Transect_2_2 |
Soil_Transect_1_2 |
SoilCO2_West_A_2 |
SoilCO2_West_B_2 |
SoilCO2_West_C_2 |
Tower_3 |
Floor_South_3 |
Floor_East_3 |
Floor_West_3 |
SoilCO2_3 |
Soil_Transect_4_3 |
Soil_Transect_3_3 |
Soil_Transect_2_3 |
Soil_Transect_1_3 |
SoilCO2_West_A_3 |
SoilCO2_West_B_3 |
SoilCO2_West_C_3 |
Tower_4 |
Floor_South_4 |
Floor_East_4 |
Floor_West_4 |
SoilCO2_4 |
Soil_Transect_4_4 |
Soil_Transect_3_4 |
Soil_Transect_2_4 |
Soil_Transect_1_4 |
SoilCO2_West_A_4 |
SoilCO2_West_B_4 |
SoilCO2_West_C_4 |
Avg | Spacial Count |
Measurement Count |
|---|---|---|---|---|---|---|---|---|---|---|---|---|---|---|---|---|---|---|---|---|---|---|---|---|---|---|---|---|---|---|---|---|---|---|---|---|---|---|---|---|---|---|---|---|---|---|---|---|---|---|---|---|---|---|
| 2014-02-10 | 41 | 0 | nan | 36.4 | 30.5 | 44.9 | 11.1 | 44.9 | 27.3 | 26.4 | 23.8 | 26.7 | 33.5 | 29.7 | 28.8 | 35.9 | 40.2 | 36.2 | 26.5 | 33.5 | 42.8 | 31.9 | 34.1 | 16.7 | 27.4 | 34.7 | 36.5 | 38.5 | 43.8 | 41.9 | 34.9 | 39.4 | 35.7 | 35.4 | 32.4 | 34.1 | 37.1 | 34.1 | 36 | 41.4 | 43.4 | 52 | 11.1 | 30.5 | 34 | 40.5 | 45.7 | 14.2 | 44 | 50.3 | 48.8 | |||
| 2014-02-10 | 41 | 1 | nan | 36.7 | 30.2 | 50.2 | 32.4 | 43.1 | 29.7 | 27.6 | 25.6 | 27.6 | 33.2 | 28.8 | 28.5 | 36.5 | 39.9 | 46.2 | 42.6 | 34.4 | 40.8 | 33.5 | 33.5 | 16.1 | 27.1 | 35.3 | 36.8 | 37.7 | 43 | 44.9 | 46.5 | 39.4 | 35.4 | 32.9 | 32.7 | 34.1 | 36.8 | 35.4 | 35.7 | 41.4 | 44.3 | 52.9 | 11.1 | 31.4 | 34.2 | 45.1 | 44.8 | 13.3 | 41.7 | 48.8 | 48.6 | |||
| 2014-02-10 | 41 | 2 | nan | 31.8 | 33.8 | 40.2 | 11.1 | |||||||||||||||||||||||||||||||||||||||||||||||
| 2014-02-10 | 41 | Avg | 0-15cm | 0 | 0 | |||||||||||||||||||||||||||||||||||||||||||||||||
| 2014-02-10 | 41 | Avg | 15-30cm | 0 | 0 | |||||||||||||||||||||||||||||||||||||||||||||||||
| 2014-02-10 | 41 | Avg | 30-45cm | 0 | 0 | |||||||||||||||||||||||||||||||||||||||||||||||||
| 2014-02-10 | 41 | Avg | 45-60cm | 0 | 0 |
mode = both
Moisture Point Probes VR
Array
(
[0] => Solar_Panels_1
[1] => Flux_Tower_1
[2] => Gate_1
[3] => Biomass_Cage_1
[4] => Solar_Panels_2
[5] => Flux_Tower_2
[6] => Gate_2
[7] => Biomass_Cage_2
[8] => Solar_Panels_3
[9] => Flux_Tower_3
[10] => Gate_3
[11] => Biomass_Cage_3
[12] => Solar_Panels_4
[13] => Flux_Tower_4
[14] => Gate_4
[15] => Biomass_Cage_4
)
| Date | DOY | Rep | Depth | Solar_Panels_1 |
Flux_Tower_1 |
Gate_1 |
Biomass_Cage_1 |
Solar_Panels_2 |
Flux_Tower_2 |
Gate_2 |
Biomass_Cage_2 |
Solar_Panels_3 |
Flux_Tower_3 |
Gate_3 |
Biomass_Cage_3 |
Solar_Panels_4 |
Flux_Tower_4 |
Gate_4 |
Biomass_Cage_4 |
Avg | Spacial Count |
Measurement Count |
|---|---|---|---|---|---|---|---|---|---|---|---|---|---|---|---|---|---|---|---|---|---|---|
| 2014-02-10 | 41 | 0 | nan | 33.2 | 29.4 | 20.6 | 11.2 | 33.2 | 30.7 | 42.5 | 28.6 | 34.2 | 12.9 | 42.1 | 33.5 | 43.2 | 31.4 | 30.5 | 32.5 | |||
| 2014-02-10 | 41 | 1 | nan | 33.2 | 29.1 | 23.5 | 10.6 | 32.6 | 30.7 | 35.3 | 28.9 | 32.7 | 12.8 | 39.4 | 32.7 | 42.8 | 30.5 | 37.7 | 32.8 | |||
| 2014-02-10 | 41 | Avg | 0-15cm | 0 | 0 | |||||||||||||||||
| 2014-02-10 | 41 | Avg | 15-30cm | 0 | 0 | |||||||||||||||||
| 2014-02-10 | 41 | Avg | 30-45cm | 0 | 0 | |||||||||||||||||
| 2014-02-10 | 41 | Avg | 45-60cm | 0 | 0 |
No TZ grass heigth found
No VR grass heigth found
Tree DBH
| Date | Tag# | Reading (mm) |
|---|---|---|
| 2014-02-10 | 2 | 19.4 |
| 2014-02-10 | 3 | 21.5 |
| 2014-02-10 | 4 | 3 |
| 2014-02-10 | 5 | 25.5 |
| 2014-02-10 | 7 | 19.4 |
| 2014-02-10 | 72 | 16.5 |
| 2014-02-10 | 79 | 22.2 |
| 2014-02-10 | 8 | 9.7 |
No water potential data found
Biomass TZ Grass
| Date | rep | AREA (cm2) | LEAFNO (count) | LEAFAREA (cm2) | Green WETWT (g) | Green DRYWT (g) | Brown WETWT (g) | Brown DRYWT (g) | LAI (m2/m2) |
Green WETWT/AREA (g/m2) |
Green DRYWT/AREA (g/m2) |
Brown WETWT/AREA (g/m2) |
Brown DRYWT/AREA (g/m2) |
|---|---|---|---|---|---|---|---|---|---|---|---|---|---|
| 2014-02-10 | 0 | 400 | 59 | 1.11 | 0.32 | 0.15 | 188.14 | 54.24 | 0 | 0 | |||
| 2014-02-10 | 1 | 400 | 120 | 1.57 | 0.48 | 0.3 | 130.83 | 40 | 0 | 0 | |||
| 2014-02-10 | 2 | 400 | 54 | 0.68 | 0.2 | 0.14 | 125.93 | 37.04 | 0 | 0 | |||
| 2014-02-10 | SUM | ||||||||||||
| 2014-02-10 | CNT | 3 | 3 | 3 | 3 | 3 | 3 | 3 | |||||
| 2014-02-10 | AVG | 0.2 | 148.3 | 43.76 |
No TZ OakLeaves Biomass data found
No TZ PineNeedles Biomass data found
1 photos found

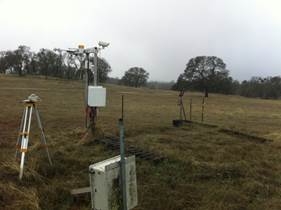
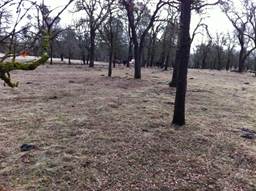
20140210TZ_TowerRoad.jpg ( 2014-02-10 13:31:22 ) Full size: 1920x1440
Wet roads and gray skies at Tonzi Tower
16 sets found
No data found for TZ_Fenergy.
11 TZ_tmet graphs found
11 TZ_soilco2 graphs found
Can't check TZ_mixed
3 TZ_mixed graphs found
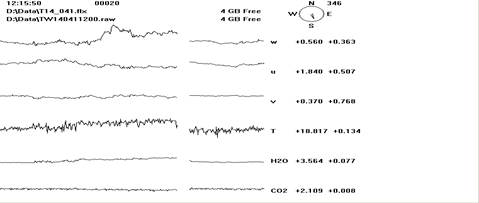
1 TZ_fflux graphs found
8 TZ_fmet graphs found
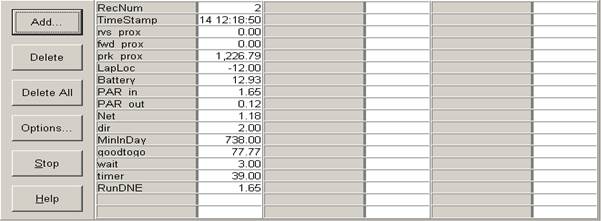
1 TZ_tram graphs found
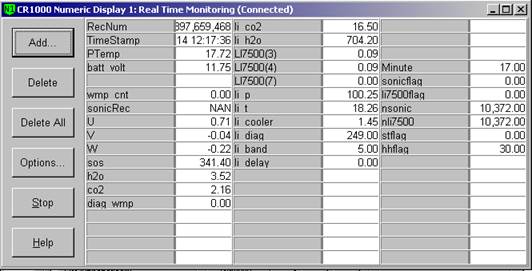
3 TZ_co2prof graphs found
No data found for TZ_irt.
No data found for TZ_windprof.
1 TZ_tflux graphs found
2 TZ_sm graphs found
Can't check TZ_met
1 TZ_met graphs found
Can't check TZVR_mixed
8 TZ_osu graphs found
No data found for TZ_fd.
Tonzi Z-cam data