
Field Notes
<--2016-01-20 13:00:00 | 2016-02-23 09:30:00-->Other sites visited today: Mayberry | Tonzi
Vaira: 2016-02-04 11:45:00 (DOY 35)
Author: Joe Verfaillie
Others: Dennis, Kyle
Summary: Nice day, Peltier SHF 1 not reading, removed Vaisala CO2 probes.
| Vaira 2016-02-04 I arrived about 11:45 with Dennis and Kyle. It was clear and sunny with little to no wind. The grass is growing slowly. There were big puddles in the road and the water hole was full. The ground was damp but not soggy. I collected data. Peltier SHF plate #1 was reading –INF. I didn’t see any problems on the surface. I will check the data and dig it up next time. Dennis did Moisture Point, but missed the one by the gate. We removed the Vaisala CO2 probes for calibration. East: 2cm – Removed previously 4cm – sn Z2720015 – this one was full of ants. 8cm – Removed previously West: 2cm – sn K1350103 4cm – sn K1350102 8cm – sn K1350101 North: 2cm – sn G0230062 4cm – sn L2010068 8cm – sn L2010070 |
Field Data
No tank data
Well Depth
| Date | Location | Depth (feet) |
|---|---|---|
| 2016-02-04 | TZ_road | 37.45 |
| 2016-02-04 | TZ_tower | 34 |
mode = both
Moisture Point Probes TZ
Array
(
[0] => Tower
[1] => Floor_South
[2] => Floor_East
[3] => Floor_West
[4] => SoilCO2
[5] => Soil_Transect_4
[6] => Soil_Transect_3
[7] => Soil_Transect_2
[8] => Soil_Transect_1
[9] => SoilCO2_West_A
[10] => SoilCO2_West_B
[11] => SoilCO2_West_C
)
| Date | DOY | Rep | Depth | Tower |
Floor_South |
Floor_East |
Floor_West |
SoilCO2 |
Soil_Transect_4 |
Soil_Transect_3 |
Soil_Transect_2 |
Soil_Transect_1 |
SoilCO2_West_A |
SoilCO2_West_B |
SoilCO2_West_C |
Avg | Spacial Count |
Measurement Count |
|---|---|---|---|---|---|---|---|---|---|---|---|---|---|---|---|---|---|---|
| 2016-02-04 | 35 | 0 | 0-15cm | 39.9 | 27.3 | 39.9 | 33.2 | 37.3 | 28.2 | 17.9 | 25 | 26.1 | 29.4 | 25.3 | 27.6 | |||
| 2016-02-04 | 35 | 0 | 15-30cm | 50 | 41.4 | 35.9 | 37.1 | 38.7 | 32.3 | 31.3 | 31.6 | 27.1 | 41.1 | 26.1 | 32.6 | |||
| 2016-02-04 | 35 | 0 | 30-45cm | 39.6 | 43.3 | 36.6 | 41 | 44.9 | 39.9 | 35.4 | 36 | 37.4 | 46.3 | 38 | 38.2 | |||
| 2016-02-04 | 35 | 0 | 45-60cm | 41.4 | 52.9 | 64.3 | 43.7 | 42 | 34.2 | 45.7 | 46.8 | 37.1 | 45.1 | 50.6 | 46.6 | |||
| 2016-02-04 | 35 | 1 | 0-15cm | 39.9 | 26.7 | 39.9 | 32.6 | 32.3 | 27.9 | 22.3 | 24.4 | 26.1 | 29.1 | 25 | 27.9 | |||
| 2016-02-04 | 35 | 1 | 15-30cm | 50 | 41.4 | 37.8 | 37.4 | 33.8 | 32.2 | 31.6 | 31.9 | 27.1 | 27.1 | 32.6 | ||||
| 2016-02-04 | 35 | 1 | 30-45cm | 39.6 | 43.8 | 39.4 | 41 | 44.9 | 39.4 | 35.2 | 35.2 | 37.4 | 38 | 38 | ||||
| 2016-02-04 | 35 | 1 | 45-60cm | 41.1 | 52 | 60.6 | 44.3 | 49.1 | 34.5 | 44.5 | 46.8 | 36.2 | 45.4 | 49.1 | 48 | |||
| 2016-02-04 | 35 | 2 | 0-15cm | 39.9 | 36.4 | 39.9 | 32.6 | 37.6 | 27.9 | 22.6 | 25 | 26.4 | 29.1 | 25 | 28.2 | |||
| 2016-02-04 | 35 | 2 | 15-30cm | 50 | 40.5 | 31.6 | 36.8 | 33.1 | 32.3 | 31.3 | 31.3 | 26.8 | 26.1 | 32.9 | ||||
| 2016-02-04 | 35 | 2 | 30-45cm | 39.6 | 44.9 | 33.8 | 41.3 | 45.2 | 39.8 | 35.2 | 35.2 | 37.1 | 52.5 | 37.7 | 37.7 | |||
| 2016-02-04 | 35 | 2 | 45-60cm | 41.1 | 52.6 | 59.2 | 45.4 | 41.1 | 34.2 | 45.1 | 47.7 | 36.2 | 45.4 | 50 | 48 | |||
| 2016-02-04 | 35 | Avg | 0-15cm | 39.9 | 30.13 | 39.9 | 32.8 | 35.73 | 28 | 20.93 | 24.8 | 26.2 | 29.2 | 25.1 | 27.9 | 30.05 | 12 | 36 |
| 2016-02-04 | 35 | Avg | 15-30cm | 50 | 41.1 | 35.1 | 37.1 | 35.2 | 32.27 | 31.4 | 31.6 | 27 | 41.1 | 26.43 | 32.7 | 35.08 | 12 | 34 |
| 2016-02-04 | 35 | Avg | 30-45cm | 39.6 | 44 | 36.6 | 41.1 | 45 | 39.7 | 35.27 | 35.47 | 37.3 | 49.4 | 37.9 | 37.97 | 39.94 | 12 | 35 |
| 2016-02-04 | 35 | Avg | 45-60cm | 41.2 | 52.5 | 61.37 | 44.47 | 44.07 | 34.3 | 45.1 | 47.1 | 36.5 | 45.3 | 49.9 | 47.53 | 45.78 | 12 | 36 |
mode = both
Moisture Point Probes VR
Array
(
[0] => Solar_Panels
[1] => Flux_Tower
[2] => Biomass_Cage
)
| Date | DOY | Rep | Depth | Solar_Panels |
Flux_Tower |
Biomass_Cage |
Avg | Spacial Count |
Measurement Count |
|---|---|---|---|---|---|---|---|---|---|
| 2016-02-04 | 35 | 0 | 0-15cm | 23.5 | 29.7 | 9.7 | |||
| 2016-02-04 | 35 | 0 | 15-30cm | 28.9 | 29.8 | 22.5 | |||
| 2016-02-04 | 35 | 0 | 30-45cm | 15.9 | 30.1 | 31.8 | |||
| 2016-02-04 | 35 | 0 | 45-60cm | 30.8 | 42.3 | 32.8 | |||
| 2016-02-04 | 35 | 1 | 0-15cm | 22.9 | 29.4 | 9.1 | |||
| 2016-02-04 | 35 | 1 | 15-30cm | 29.5 | 31 | 22.8 | |||
| 2016-02-04 | 35 | 1 | 30-45cm | 15.9 | 31.6 | 30.4 | |||
| 2016-02-04 | 35 | 1 | 45-60cm | 29.9 | 43.1 | 32.8 | |||
| 2016-02-04 | 35 | 2 | 0-15cm | 22.9 | 29.4 | 9.7 | |||
| 2016-02-04 | 35 | 2 | 15-30cm | 29.8 | 30.4 | 22.5 | |||
| 2016-02-04 | 35 | 2 | 30-45cm | 15.9 | 31.8 | 30.1 | |||
| 2016-02-04 | 35 | 2 | 45-60cm | 30.8 | 42.8 | 31.9 | |||
| 2016-02-04 | 35 | Avg | 0-15cm | 23.1 | 29.5 | 9.5 | 20.7 | 3 | 9 |
| 2016-02-04 | 35 | Avg | 15-30cm | 29.4 | 30.4 | 22.6 | 27.47 | 3 | 9 |
| 2016-02-04 | 35 | Avg | 30-45cm | 15.9 | 31.17 | 30.77 | 25.95 | 3 | 9 |
| 2016-02-04 | 35 | Avg | 45-60cm | 30.5 | 42.73 | 32.5 | 35.24 | 3 | 9 |
No TZ grass heigth found
No VR grass heigth found
Tree DBH
| Date | Tag# | Reading (mm) |
|---|
No water potential data found
No VR Grass Biomass data found
No VR OakLeaves Biomass data found
No VR PineNeedles Biomass data found
3 photos found
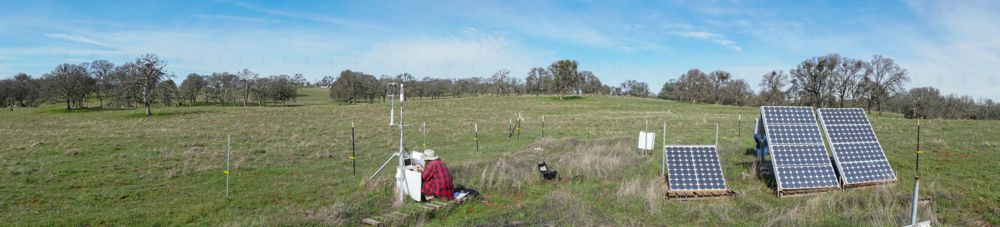
20160204VR_JoePano.jpg ( 2016-02-04 15:58:50 ) Full size: 1000x227
view of field site
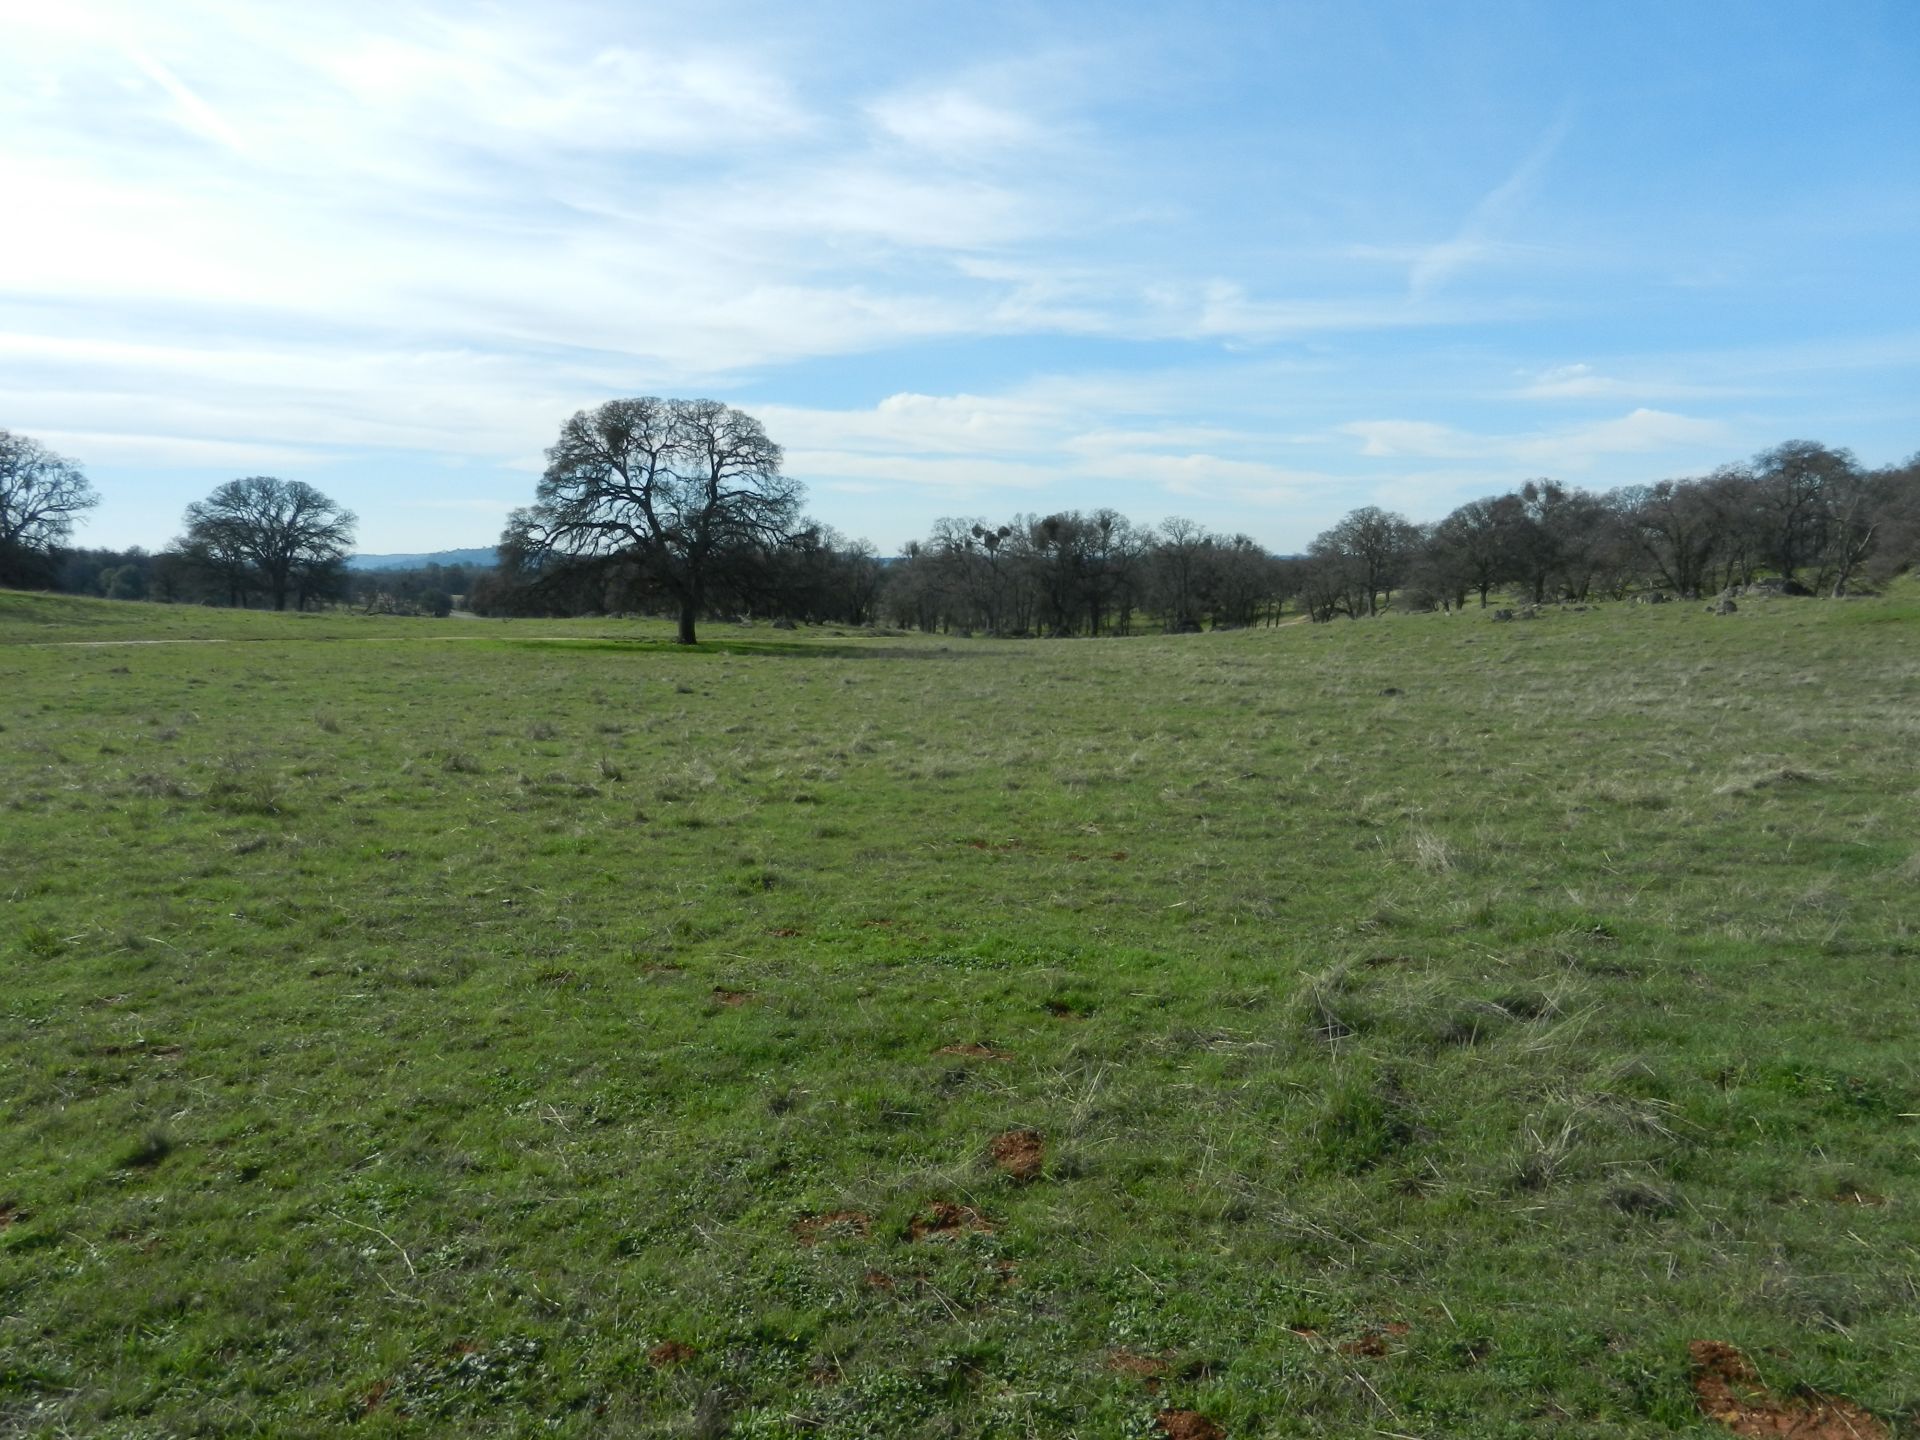
20160204VR_Green.jpg ( 2016-02-04 13:04:23 ) Full size: 1920x1440
view of field site
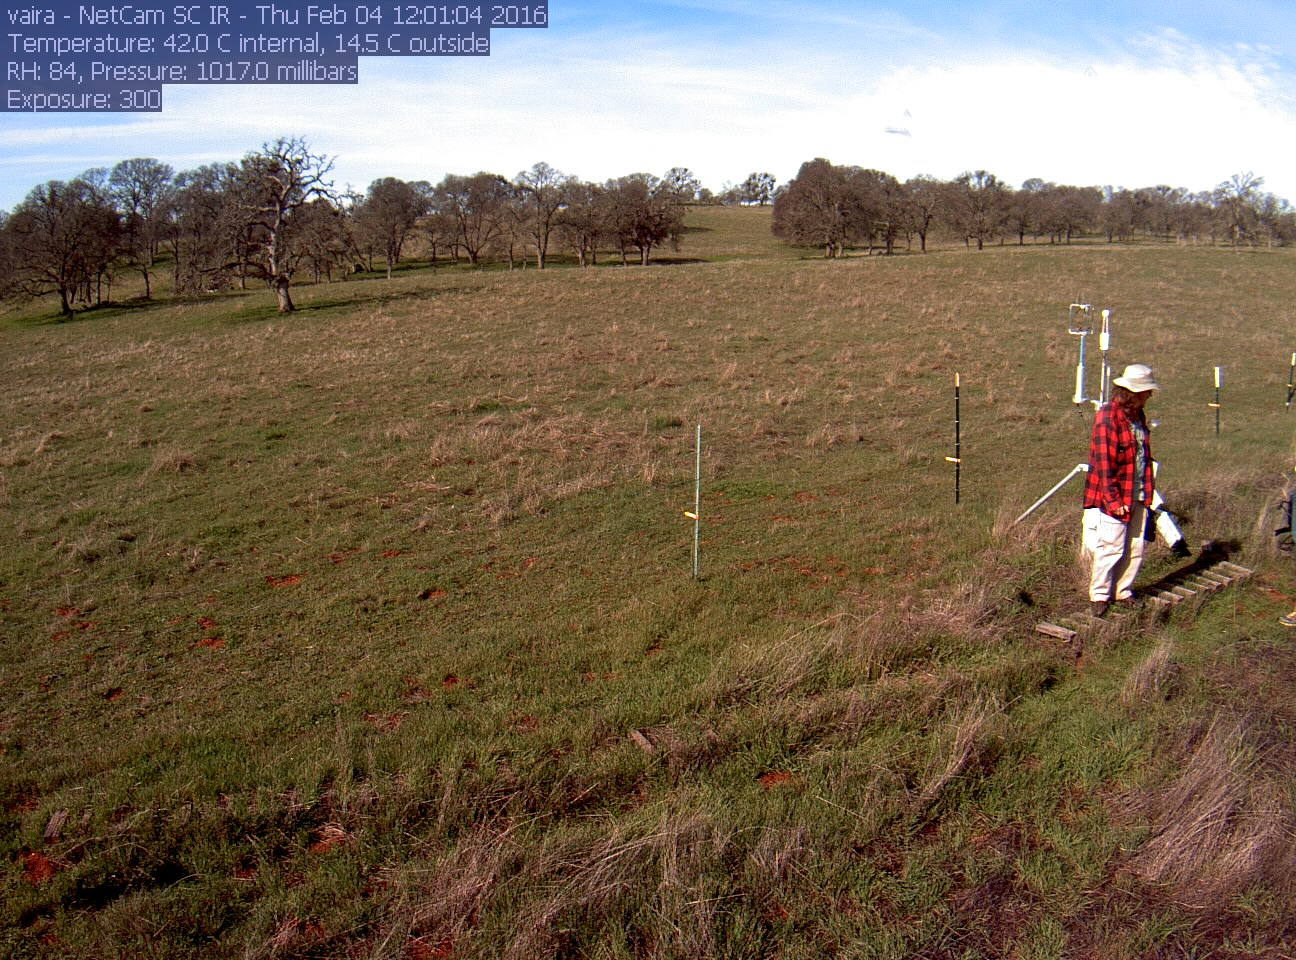
vaira_2016_02_04_120104.jpg ( 2016-02-04 18:27:42 ) Full size: 1296x960
Joe on site
9 sets found
16 VR_met graphs found
2 VR_flux graphs found
6 VR_soilco2 graphs found
No data found for VR_pond.
Can't check TZVR_mixed
No data found for VR_fd.
No data found for VR_processed.
No data found for VR_arable.
No data found for VR_soilvue.