
Field Notes
<--2015-12-23 09:30:00 | 2016-02-04 11:45:00-->Other sites visited today: Tonzi | Tonzi
Phenocam link: Searching...
Vaira: 2016-01-20 13:00:00 (DOY 20)
Author: Joe Verfaillie
Others: Siyan
Summary: Checked on soil CO2 system, main solar batteries and fixed cow fence.
| Vaira 2016-01-20 I arrived about 1pm with Siyan. We have had several days of heavy rain, but today is mostly sunny and warm. The land all around is very green with new grass. There are lots of puddles and running water in the low spots. The water hole is almost completely full. I looked at the soil co2 system. The broken cable was labeled 8cm and the other disturbed probe was from the location labeled 2cm. The 4cm is still in place. I removed the broken cable. I think all the probes need calibration and a reset with better mounting. I also checked on the main solar batteries. The residue in the east box may just be baking soda. The batteries are Maxrate MR12-350, Dynasty UPS brand and have dates of September and October of 2005. The cow fence was shorted to the barbed wire on the east side of the fence. The four band radiometer with Hobo data logger that someone strapped to the tower long ago was falling off. I put it back on but need to find who it belongs to and remove it. |
Field Data
No tank data
Well Depth
| Date | Location | Depth (feet) |
|---|---|---|
| 2016-01-20 | TZ_floor | 32.2 |
| 2016-01-20 | TZ_road | 39.8 |
| 2016-01-20 | TZ_tower | 37.4 |
mode = both
Moisture Point Probes TZ
Array
(
[0] => Tower_1
[1] => Floor_South_1
[2] => Floor_East_1
[3] => Floor_West_1
[4] => SoilCO2_1
[5] => Soil_Transect_4_1
[6] => Soil_Transect_3_1
[7] => Soil_Transect_2_1
[8] => Soil_Transect_1_1
[9] => SoilCO2_West_A_1
[10] => SoilCO2_West_B_1
[11] => SoilCO2_West_C_1
[12] => Tower_2
[13] => Floor_South_2
[14] => Floor_East_2
[15] => Floor_West_2
[16] => SoilCO2_2
[17] => Soil_Transect_4_2
[18] => Soil_Transect_3_2
[19] => Soil_Transect_2_2
[20] => Soil_Transect_1_2
[21] => SoilCO2_West_A_2
[22] => SoilCO2_West_B_2
[23] => SoilCO2_West_C_2
[24] => Tower_3
[25] => Floor_South_3
[26] => Floor_East_3
[27] => Floor_West_3
[28] => SoilCO2_3
[29] => Soil_Transect_4_3
[30] => Soil_Transect_3_3
[31] => Soil_Transect_2_3
[32] => Soil_Transect_1_3
[33] => SoilCO2_West_A_3
[34] => SoilCO2_West_B_3
[35] => SoilCO2_West_C_3
[36] => Tower_4
[37] => Floor_South_4
[38] => Floor_East_4
[39] => Floor_West_4
[40] => SoilCO2_4
[41] => Soil_Transect_4_4
[42] => Soil_Transect_3_4
[43] => Soil_Transect_2_4
[44] => Soil_Transect_1_4
[45] => SoilCO2_West_A_4
[46] => SoilCO2_West_B_4
[47] => SoilCO2_West_C_4
)
| Date | DOY | Rep | Depth | Tower_1 |
Floor_South_1 |
Floor_East_1 |
Floor_West_1 |
SoilCO2_1 |
Soil_Transect_4_1 |
Soil_Transect_3_1 |
Soil_Transect_2_1 |
Soil_Transect_1_1 |
SoilCO2_West_A_1 |
SoilCO2_West_B_1 |
SoilCO2_West_C_1 |
Tower_2 |
Floor_South_2 |
Floor_East_2 |
Floor_West_2 |
SoilCO2_2 |
Soil_Transect_4_2 |
Soil_Transect_3_2 |
Soil_Transect_2_2 |
Soil_Transect_1_2 |
SoilCO2_West_A_2 |
SoilCO2_West_B_2 |
SoilCO2_West_C_2 |
Tower_3 |
Floor_South_3 |
Floor_East_3 |
Floor_West_3 |
SoilCO2_3 |
Soil_Transect_4_3 |
Soil_Transect_3_3 |
Soil_Transect_2_3 |
Soil_Transect_1_3 |
SoilCO2_West_A_3 |
SoilCO2_West_B_3 |
SoilCO2_West_C_3 |
Tower_4 |
Floor_South_4 |
Floor_East_4 |
Floor_West_4 |
SoilCO2_4 |
Soil_Transect_4_4 |
Soil_Transect_3_4 |
Soil_Transect_2_4 |
Soil_Transect_1_4 |
SoilCO2_West_A_4 |
SoilCO2_West_B_4 |
SoilCO2_West_C_4 |
Avg | Spacial Count |
Measurement Count |
|---|---|---|---|---|---|---|---|---|---|---|---|---|---|---|---|---|---|---|---|---|---|---|---|---|---|---|---|---|---|---|---|---|---|---|---|---|---|---|---|---|---|---|---|---|---|---|---|---|---|---|---|---|---|---|
| 2016-01-20 | 20 | 0 | nan | 49.3 | 27 | 63.4 | 37.9 | 44.3 | 33.8 | 22.9 | 28.2 | 31.1 | 33.8 | 30.8 | 34.6 | 40.5 | 34.4 | 25.8 | 41.4 | 38.1 | 49.6 | 34.7 | 37.4 | 42.6 | 51.1 | 49.1 | 34.1 | 40.5 | 44.1 | 25.4 | 44.9 | 44.6 | 37.4 | 34.9 | 33.5 | 35.7 | 45.5 | 36.8 | 37.1 | 39.7 | 47.1 | 60 | 37.4 | 42 | 34.8 | 45.4 | 47.1 | 36 | 44.5 | 50.9 | 56.6 | |||
| 2016-01-20 | 20 | 1 | nan | 49 | 26.4 | 64.2 | 37.9 | 42.8 | 29.7 | 16.2 | 27.3 | 30.5 | 36.7 | 32 | 35.2 | 41.1 | 40.8 | 25.8 | 40.8 | 37.8 | 40.2 | 34.1 | 36.6 | 43.3 | 50.6 | 49.1 | 34.1 | 39.6 | 44.1 | 25.7 | 43.5 | 44.1 | 37.1 | 34.6 | 34.3 | 36.8 | 43.2 | 36.8 | 37.7 | 42.5 | 47.1 | 60.6 | 37.1 | 42 | 35.1 | 45.4 | 49.7 | 35.4 | 45.1 | 49.7 | 49.7 | |||
| 2016-01-20 | 20 | Avg | 0-15cm | 0 | 0 | |||||||||||||||||||||||||||||||||||||||||||||||||
| 2016-01-20 | 20 | Avg | 15-30cm | 0 | 0 | |||||||||||||||||||||||||||||||||||||||||||||||||
| 2016-01-20 | 20 | Avg | 30-45cm | 0 | 0 | |||||||||||||||||||||||||||||||||||||||||||||||||
| 2016-01-20 | 20 | Avg | 45-60cm | 0 | 0 |
mode = both
Moisture Point Probes VR
Array
(
[0] => Solar_Panels_1
[1] => Flux_Tower_1
[2] => Gate_1
[3] => Biomass_Cage_1
[4] => Solar_Panels_2
[5] => Flux_Tower_2
[6] => Gate_2
[7] => Biomass_Cage_2
[8] => Solar_Panels_3
[9] => Flux_Tower_3
[10] => Gate_3
[11] => Biomass_Cage_3
[12] => Solar_Panels_4
[13] => Flux_Tower_4
[14] => Gate_4
[15] => Biomass_Cage_4
)
| Date | DOY | Rep | Depth | Solar_Panels_1 |
Flux_Tower_1 |
Gate_1 |
Biomass_Cage_1 |
Solar_Panels_2 |
Flux_Tower_2 |
Gate_2 |
Biomass_Cage_2 |
Solar_Panels_3 |
Flux_Tower_3 |
Gate_3 |
Biomass_Cage_3 |
Solar_Panels_4 |
Flux_Tower_4 |
Gate_4 |
Biomass_Cage_4 |
Avg | Spacial Count |
Measurement Count |
|---|---|---|---|---|---|---|---|---|---|---|---|---|---|---|---|---|---|---|---|---|---|---|
| 2016-01-20 | 20 | 0 | nan | 32.6 | 25 | 24.1 | 12.7 | 31.9 | 30.1 | 25.8 | 36.8 | 32.7 | 17 | 31 | 31 | 44 | 31.7 | 34.5 | 33.4 | |||
| 2016-01-20 | 20 | 1 | nan | 32.3 | 25 | 25 | 13 | 32.3 | 29.8 | 25.8 | 25.8 | 32.7 | 17.6 | 29.6 | 31.3 | 44.5 | 31.7 | 35.9 | 34.5 | |||
| 2016-01-20 | 20 | Avg | 0-15cm | 0 | 0 | |||||||||||||||||
| 2016-01-20 | 20 | Avg | 15-30cm | 0 | 0 | |||||||||||||||||
| 2016-01-20 | 20 | Avg | 30-45cm | 0 | 0 | |||||||||||||||||
| 2016-01-20 | 20 | Avg | 45-60cm | 0 | 0 |
No TZ grass heigth found
No VR grass heigth found
No VR Tree DBH found
No water potential data found
No VR Grass Biomass data found
No VR OakLeaves Biomass data found
No VR PineNeedles Biomass data found
1 photos found
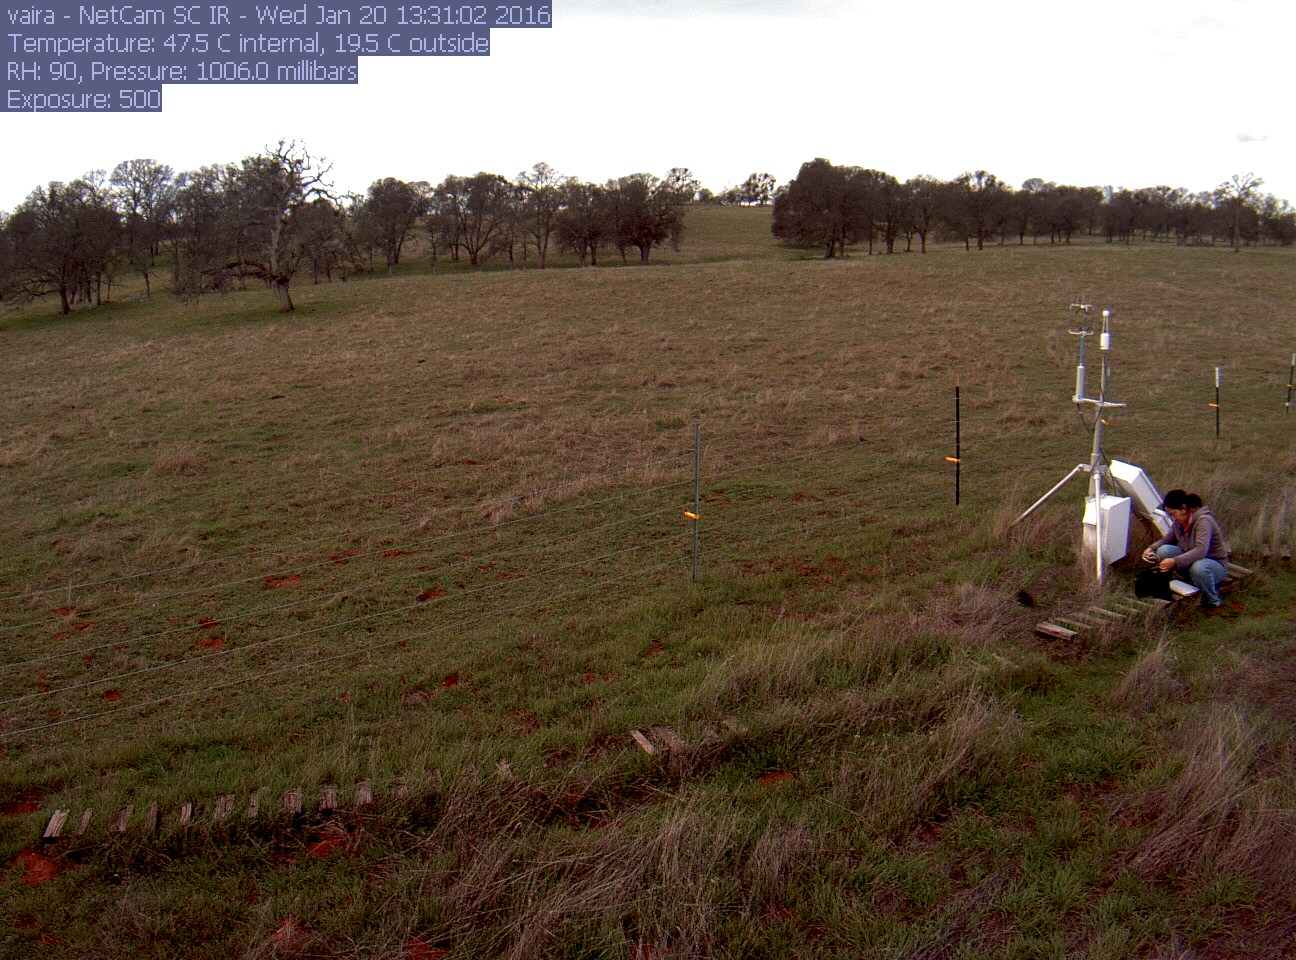
vaira_2016_01_20_133102.jpg ( 2016-01-20 19:57:14 ) Full size: 1296x960
Siyan on site
9 sets found
16 VR_met graphs found
2 VR_flux graphs found
6 VR_soilco2 graphs found
No data found for VR_pond.
Can't check TZVR_mixed
No data found for VR_fd.
No data found for VR_processed.
No data found for VR_arable.
No data found for VR_soilvue.