
Field Notes
<--2016-07-28 10:00:00 | 2016-09-13 10:30:00-->Tonzi: 2016-08-23 10:00:00 (DOY 236)
Author: Siyan Ma
Others:
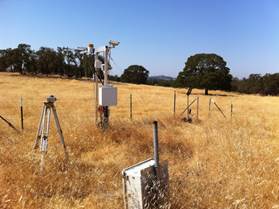
Summary: Standard fieldwork, very dry, swapper all 7500s, manual well meter not working - estimated by wetness, floor fence charger not working, understory HMP fan not working.
|
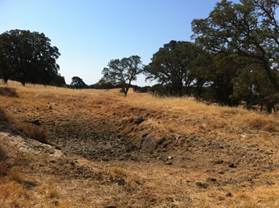
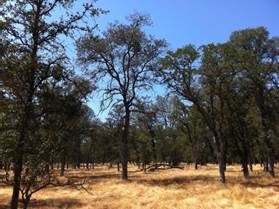
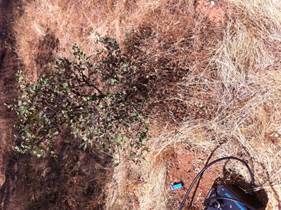
When: Date: 8/23/2016 , Day: 236 , Watch Time: 10:00 am . Where: Tonzi/Vaira Ranch Who: Siyan Weather: clear, sunny Phenology: Vaira pond dry, oak water stressed
Summary
Vaira_Grass Site
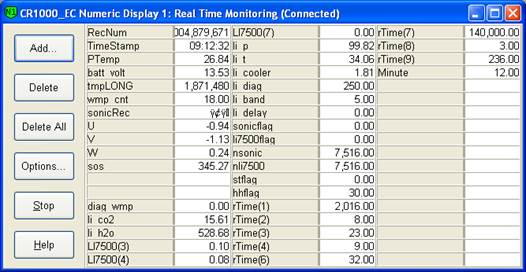
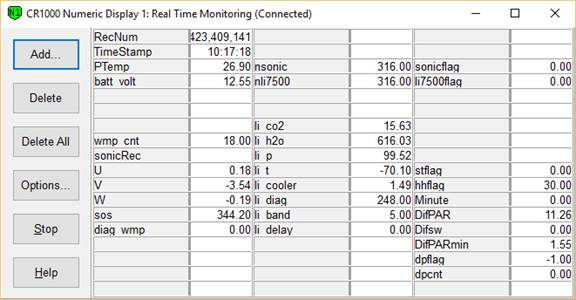
Tonzi_Tower Site
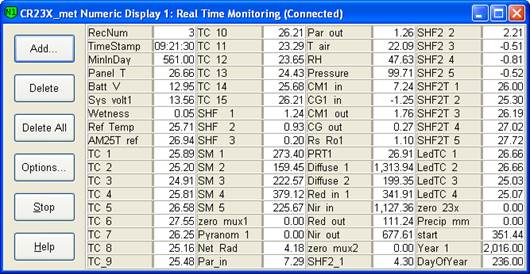
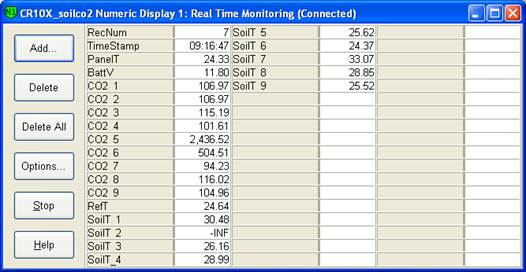
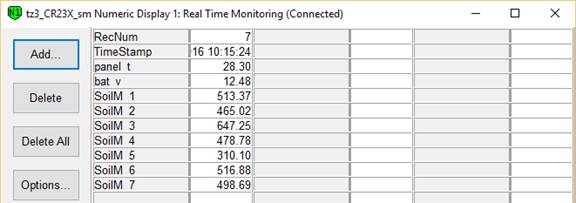
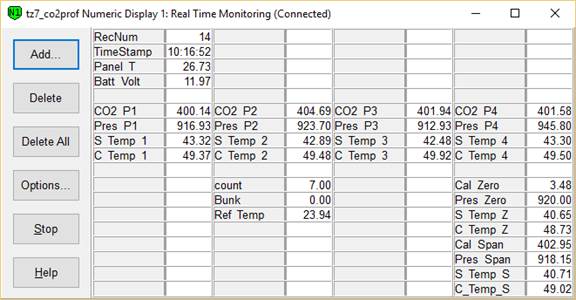
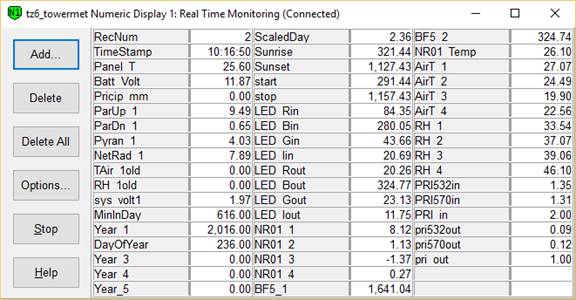
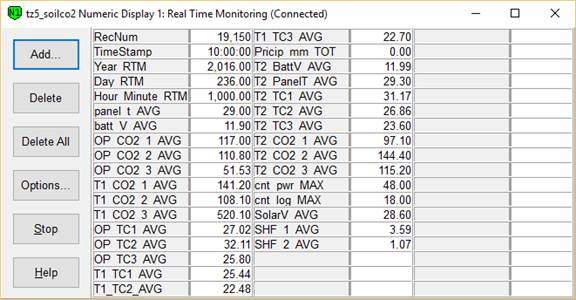
CR23X3 – floor-Met CR23X6 – tower-Met CR10X2 – floor-Met Soil CO2 profile: CR23X5 – soil CO2 profile
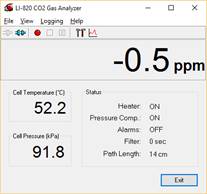
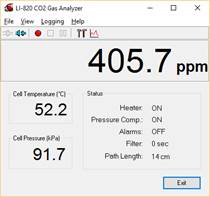
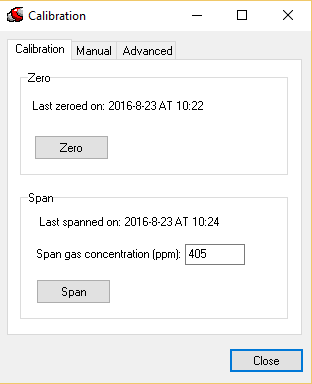
before zero
before span
after
9. closed gate and set up fence. YES! Toniz_Floor Site
|
Field Data
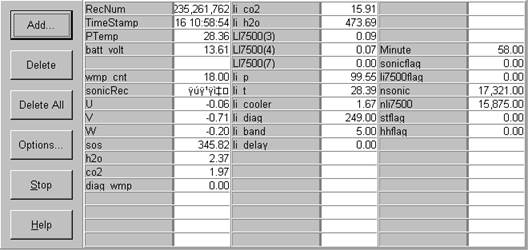
No tank data
Well Depth
| Date | Location | Depth (feet) |
|---|---|---|
| 2016-08-23 | TZ_floor | 23 |
| 2016-08-23 | TZ_road | 36.3 |
| 2016-08-23 | TZ_tower | 32.3 |
mode = both
Moisture Point Probes TZ
Array
(
[0] => Tower
[1] => Floor_South
[2] => Floor_East
[3] => Floor_West
[4] => SoilCO2
[5] => Soil_Transect_4
[6] => Soil_Transect_3
[7] => Soil_Transect_2
[8] => Soil_Transect_1
[9] => SoilCO2_West_A
[10] => SoilCO2_West_B
[11] => SoilCO2_West_C
)
| Date | DOY | Rep | Depth | Tower |
Floor_South |
Floor_East |
Floor_West |
SoilCO2 |
Soil_Transect_4 |
Soil_Transect_3 |
Soil_Transect_2 |
Soil_Transect_1 |
SoilCO2_West_A |
SoilCO2_West_B |
SoilCO2_West_C |
Avg | Spacial Count |
Measurement Count |
|---|---|---|---|---|---|---|---|---|---|---|---|---|---|---|---|---|---|---|
| 2016-08-23 | 236 | 0 | 0-15cm | 5.3 | 5.9 | 7.1 | 5.3 | 7.7 | 0.1 | 3 | 3.9 | 6.8 | 6.8 | 1.5 | 1.8 | |||
| 2016-08-23 | 236 | 0 | 15-30cm | 10.3 | 11.8 | 9.3 | 4.5 | 6.9 | 9.3 | 14.2 | 11.8 | 0.2 | 7.2 | 1.5 | 11.5 | |||
| 2016-08-23 | 236 | 0 | 30-45cm | 16.5 | 7 | 22.1 | 22.9 | 5.3 | 9.5 | 16.2 | 16.2 | 14.3 | 16.5 | 16.5 | 10.3 | |||
| 2016-08-23 | 236 | 0 | 45-60cm | 10.7 | 3.6 | 20.2 | 11.1 | 19.9 | 12.2 | 17 | 23.6 | 10.7 | 18.5 | 15.3 | 22.5 | |||
| 2016-08-23 | 236 | 1 | 0-15cm | 5.3 | 5.9 | 7.1 | 7.4 | 0.1 | 7.7 | 4.5 | 6.5 | 6.8 | 4.5 | 1.2 | ||||
| 2016-08-23 | 236 | 1 | 15-30cm | 9.7 | 12.1 | 10.3 | 4.2 | 6.6 | 9.7 | 3.6 | 11.5 | 4.5 | 7.2 | 1.5 | 11.2 | |||
| 2016-08-23 | 236 | 1 | 30-45cm | 16.5 | 7 | 19.8 | 19.9 | 5.3 | 9.2 | 15.9 | 16.5 | 13.7 | 16.8 | 15.9 | 16.5 | |||
| 2016-08-23 | 236 | 1 | 45-60cm | 10.2 | 3.6 | 19.1 | 11.1 | 19.5 | 11 | 17.3 | 23.1 | 10.9 | 17.3 | 14.5 | 21.9 | |||
| 2016-08-23 | 236 | Avg | 0-15cm | 5.3 | 5.9 | 7.1 | 5.3 | 7.55 | 0.1 | 5.35 | 4.2 | 6.65 | 6.8 | 3 | 1.5 | 4.9 | 12 | 23 |
| 2016-08-23 | 236 | Avg | 15-30cm | 10 | 11.95 | 9.8 | 4.35 | 6.75 | 9.5 | 8.9 | 11.65 | 2.35 | 7.2 | 1.5 | 11.35 | 7.94 | 12 | 24 |
| 2016-08-23 | 236 | Avg | 30-45cm | 16.5 | 7 | 20.95 | 21.4 | 5.3 | 9.35 | 16.05 | 16.35 | 14 | 16.65 | 16.2 | 13.4 | 14.43 | 12 | 24 |
| 2016-08-23 | 236 | Avg | 45-60cm | 10.45 | 3.6 | 19.65 | 11.1 | 19.7 | 11.6 | 17.15 | 23.35 | 10.8 | 17.9 | 14.9 | 22.2 | 15.2 | 12 | 24 |
mode = both
Moisture Point Probes VR
Array
(
[0] => Solar_Panels
[1] => Flux_Tower
[2] => Gate
[3] => Biomass_Cage
)
| Date | DOY | Rep | Depth | Solar_Panels |
Flux_Tower |
Gate |
Biomass_Cage |
Avg | Spacial Count |
Measurement Count |
|---|---|---|---|---|---|---|---|---|---|---|
| 2016-08-23 | 236 | 0 | 0-15cm | 0.4 | 1 | 1.8 | 0.1 | |||
| 2016-08-23 | 236 | 0 | 15-30cm | 8.7 | 6.3 | 6.3 | 2.9 | |||
| 2016-08-23 | 236 | 0 | 30-45cm | 14.3 | 4.2 | 11.2 | 13.4 | |||
| 2016-08-23 | 236 | 0 | 45-60cm | 27.6 | 14.8 | 11.6 | 16.5 | |||
| 2016-08-23 | 236 | 1 | 0-15cm | 0.4 | 0.4 | 1.8 | 0.1 | |||
| 2016-08-23 | 236 | 1 | 15-30cm | 8.1 | 6.3 | 6 | 3.2 | |||
| 2016-08-23 | 236 | 1 | 30-45cm | 14.3 | 5 | 11.7 | 13.1 | |||
| 2016-08-23 | 236 | 1 | 45-60cm | 27.4 | 15.3 | 11.3 | 15.9 | |||
| 2016-08-23 | 236 | Avg | 0-15cm | 0.4 | 0.7 | 1.8 | 0.1 | 0.75 | 4 | 8 |
| 2016-08-23 | 236 | Avg | 15-30cm | 8.4 | 6.3 | 6.15 | 3.05 | 5.98 | 4 | 8 |
| 2016-08-23 | 236 | Avg | 30-45cm | 14.3 | 4.6 | 11.45 | 13.25 | 10.9 | 4 | 8 |
| 2016-08-23 | 236 | Avg | 45-60cm | 27.5 | 15.05 | 11.45 | 16.2 | 17.55 | 4 | 8 |
No TZ grass heigth found
No VR grass heigth found
Tree DBH
| Date | Tag# | Reading (mm) |
|---|---|---|
| 2016-08-23 | 102 | 19.9 |
| 2016-08-23 | 2 | 18.8 |
| 2016-08-23 | 245 | 22.8 |
| 2016-08-23 | 3 | 22.1 |
| 2016-08-23 | 4 | 16.0 |
| 2016-08-23 | 5 | 18.5 |
| 2016-08-23 | 7 | 15.8 |
| 2016-08-23 | 72 | 23.4 |
| 2016-08-23 | 79 | 23.2 |
| 2016-08-23 | 8 | 18.7 |
Water Potential - mode: raw
| Time< h> | Species | Tree | readings (bar) | ||
|---|---|---|---|---|---|
| 2016-08-23 01:13:00 | OAK | 102 | -48 | -42 | -33 |
| 2016-08-23 01:13:00 | OAK | 35 | -40 | -41 | -35 |
| 2016-08-23 01:13:00 | OAK | 92 | -35 | -41 | -30 |
| 2016-08-23 01:30:00 | PINE | OLD | -19 | -7 | -6 |
| 2016-08-23 01:30:00 | PINE | YNG | -1 | -1 | -0.9 |
| OAK_102 | Whole Study | 20160823 | 01:13:00 | twig/leaf cluster | -4.1 | 0.75 | 3 | |
| OAK_35 | Whole Study | 20160823 | 01:13:00 | twig/leaf cluster | -3.9 | 0.32 | 3 | |
| OAK_92 | Whole Study | 20160823 | 01:13:00 | twig/leaf cluster | -3.5 | 0.55 | 3 | |
| PINE_OLD | Whole Study | 20160823 | 01:30:00 | twig/leaf cluster | -1.1 | 0.72 | 3 | |
| PINE_YNG | Whole Study | 20160823 | 01:30:00 | twig/leaf cluster | -0.1 | 0.01 | 3 |
No TZ Grass Biomass data found
No TZ OakLeaves Biomass data found
No TZ PineNeedles Biomass data found
0 photos found
16 sets found
No data found for TZ_Fenergy.
11 TZ_tmet graphs found
11 TZ_soilco2 graphs found
Can't check TZ_mixed
3 TZ_mixed graphs found
1 TZ_fflux graphs found
8 TZ_fmet graphs found
No data found for TZ_tram.
3 TZ_co2prof graphs found
1 TZ_irt graphs found
No data found for TZ_windprof.
1 TZ_tflux graphs found
2 TZ_sm graphs found
Can't check TZ_met
1 TZ_met graphs found
Can't check TZVR_mixed
No data found for TZ_osu.
No data found for TZ_fd.
Tonzi Z-cam data