
Field Notes
<--2014-10-24 10:30:00 | 2014-11-26 09:40:00-->Tonzi: 2014-11-13 09:30:00 (DOY 317)
Author: Siyan Ma
Others:
Summary: Standard fieldwork, rain last night and a little this morning, Tower fence broken, did not collect z-cam images
|
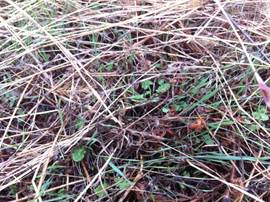
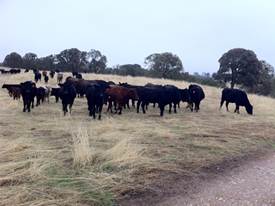
When: Date: 11/13/2014 , Day: 317 , Watch Time: 9:30 am . Where: Tonzi/Vaira Ranch Who: Siyan Weather: cloudy, dripping a little Phenology: grasses germinated; oak leaves still green at Vaira; a lot of cows at both sites
Summary
Vaira_Grass Site
Tonzi_Tower Site
Is the pump running‌ YES! 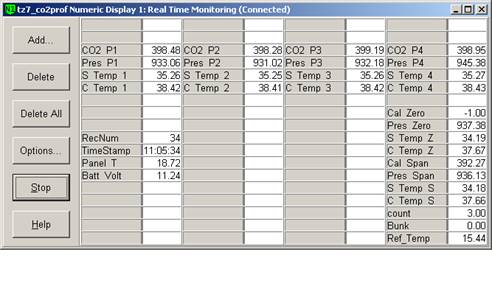 Before span 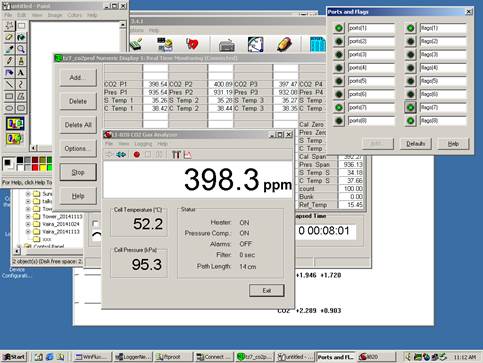 After span 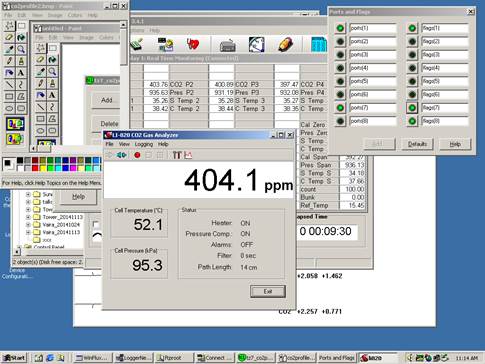 9. The fence need new wires. Toniz_Floor Site
CR23X3 – floor-Met CR23X6 – tower-Met CR10X2 – floor-Met Soil CO2 profile: CR23X5 – soil CO2 profile     5. Closed gate and set up fence. YES! |
Field Data
CO2 Profile Tanks
| Date | Tank | Pressure (psi) | ppm |
|---|---|---|---|
| 2014-11-13 | CO2 | 600 | 402.68 |
| 2014-11-13 | N2 | 1500 | 0 |
Well Depth
| Date | Location | Depth (feet) |
|---|---|---|
| 2014-11-13 | TZ_floor | 32.7 |
| 2014-11-13 | TZ_road | 40 |
| 2014-11-13 | TZ_tower | 36.6 |
mode = both
Moisture Point Probes TZ
Array
(
[0] => Tower
[1] => Floor_South
[2] => Floor_East
[3] => Floor_West
[4] => SoilCO2
[5] => Soil_Transect_4
[6] => Soil_Transect_3
[7] => Soil_Transect_2
[8] => Soil_Transect_1
[9] => SoilCO2_West_A
[10] => SoilCO2_West_B
[11] => SoilCO2_West_C
)
| Date | DOY | Rep | Depth | Tower |
Floor_South |
Floor_East |
Floor_West |
SoilCO2 |
Soil_Transect_4 |
Soil_Transect_3 |
Soil_Transect_2 |
Soil_Transect_1 |
SoilCO2_West_A |
SoilCO2_West_B |
SoilCO2_West_C |
Avg | Spacial Count |
Measurement Count |
|---|---|---|---|---|---|---|---|---|---|---|---|---|---|---|---|---|---|---|
| 2014-11-13 | 317 | 0 | 0-15cm | 13 | 4.2 | 11.1 | 11.1 | 11.1 | 9.1 | 15.3 | 10.3 | 8.3 | 15.6 | 17.3 | 10.3 | |||
| 2014-11-13 | 317 | 0 | 15-30cm | 7.8 | 6.3 | 21.3 | 9 | 13 | 12.7 | 18.5 | 13.9 | 4.2 | 14.5 | 5.7 | 14.8 | |||
| 2014-11-13 | 317 | 0 | 30-45cm | 15.6 | 6.7 | 20.8 | 11.7 | 5 | 8.7 | 13.4 | 15.6 | 12 | 14.5 | 17.3 | 12 | |||
| 2014-11-13 | 317 | 0 | 45-60cm | 9.9 | 7.6 | 10.2 | 16.2 | 15.3 | 10.5 | 15 | 8.5 | 14.8 | ||||||
| 2014-11-13 | 317 | 1 | 0-15cm | 10.9 | 11.1 | |||||||||||||
| 2014-11-13 | 317 | 1 | 15-30cm | 8.4 | 7.5 | |||||||||||||
| 2014-11-13 | 317 | 1 | 30-45cm | 15.6 | 12.3 | |||||||||||||
| 2014-11-13 | 317 | Avg | 0-15cm | 11.95 | 4.2 | 11.1 | 11.1 | 11.1 | 9.1 | 15.3 | 10.3 | 8.3 | 15.6 | 17.3 | 10.3 | 11.3 | 12 | 14 |
| 2014-11-13 | 317 | Avg | 15-30cm | 8.1 | 6.3 | 21.3 | 8.25 | 13 | 12.7 | 18.5 | 13.9 | 4.2 | 14.5 | 5.7 | 14.8 | 11.77 | 12 | 14 |
| 2014-11-13 | 317 | Avg | 30-45cm | 15.6 | 6.7 | 20.8 | 12 | 5 | 8.7 | 13.4 | 15.6 | 12 | 14.5 | 17.3 | 12 | 12.8 | 12 | 14 |
| 2014-11-13 | 317 | Avg | 45-60cm | 9.9 | 7.6 | 10.2 | 16.2 | 15.3 | 10.5 | 15 | 8.5 | 14.8 | 12 | 9 | 9 |
mode = both
Moisture Point Probes VR
Array
(
[0] => Solar_Panels
[1] => Flux_Tower
[2] => Gate
[3] => Biomass_Cage
)
| Date | DOY | Rep | Depth | Solar_Panels |
Flux_Tower |
Gate |
Biomass_Cage |
Avg | Spacial Count |
Measurement Count |
|---|---|---|---|---|---|---|---|---|---|---|
| 2014-11-13 | 317 | 0 | 0-15cm | 13 | 12.4 | 10.3 | 4.7 | |||
| 2014-11-13 | 317 | 0 | 15-30cm | 11.8 | 11.5 | 8.1 | 9 | |||
| 2014-11-13 | 317 | 0 | 30-45cm | 13.4 | 5.6 | 8.7 | 12.3 | |||
| 2014-11-13 | 317 | 0 | 45-60cm | 24.2 | 9.6 | 8.7 | 14.2 | |||
| 2014-11-13 | 317 | 1 | 0-15cm | 9.7 | 4.5 | |||||
| 2014-11-13 | 317 | 1 | 15-30cm | 7.8 | 9.3 | |||||
| 2014-11-13 | 317 | 1 | 30-45cm | 9.2 | 12 | |||||
| 2014-11-13 | 317 | 1 | 45-60cm | 8.5 | 14.2 | |||||
| 2014-11-13 | 317 | Avg | 0-15cm | 13 | 12.4 | 10 | 4.6 | 10 | 4 | 6 |
| 2014-11-13 | 317 | Avg | 15-30cm | 11.8 | 11.5 | 7.95 | 9.15 | 10.1 | 4 | 6 |
| 2014-11-13 | 317 | Avg | 30-45cm | 13.4 | 5.6 | 8.95 | 12.15 | 10.03 | 4 | 6 |
| 2014-11-13 | 317 | Avg | 45-60cm | 24.2 | 9.6 | 8.6 | 14.2 | 14.15 | 4 | 6 |
No TZ grass heigth found
No VR grass heigth found
Tree DBH
| Date | Tag# | Reading (mm) |
|---|---|---|
| 2014-11-13 | 1 | 10.0 |
| 2014-11-13 | 102 | 7.8 |
| 2014-11-13 | 2 | 11.1 |
| 2014-11-13 | 245 | 18.5 |
| 2014-11-13 | 3 | 9.7 |
| 2014-11-13 | 4 | 8.5 |
| 2014-11-13 | 5 | 11.4 |
| 2014-11-13 | 7 | 9.0 |
| 2014-11-13 | 72 | 18.5 |
| 2014-11-13 | 79 | 13.1 |
| 2014-11-13 | 8 | 12.5 |
No water potential data found
No TZ Grass Biomass data found
No TZ OakLeaves Biomass data found
No TZ PineNeedles Biomass data found
1 photos found
tonzi_2014_11_14_083101.jpg ( 2014-11-14 08:35:02 ) Full size: 1296x960
Fog
16 sets found
No data found for TZ_Fenergy.
11 TZ_tmet graphs found
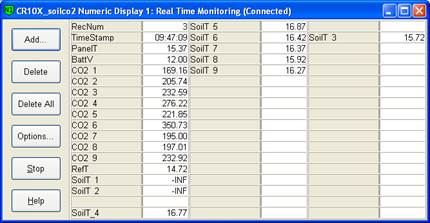
11 TZ_soilco2 graphs found
Can't check TZ_mixed
3 TZ_mixed graphs found
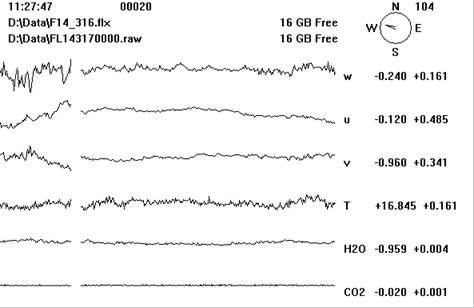
1 TZ_fflux graphs found
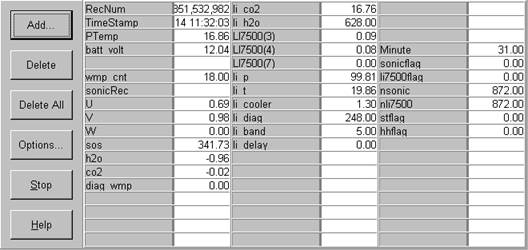
8 TZ_fmet graphs found
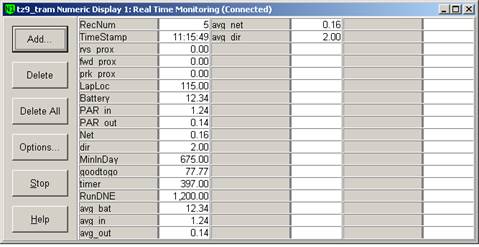
1 TZ_tram graphs found
3 TZ_co2prof graphs found
No data found for TZ_irt.
No data found for TZ_windprof.
1 TZ_tflux graphs found
2 TZ_sm graphs found
Can't check TZ_met
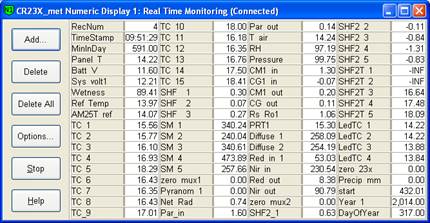
1 TZ_met graphs found
Can't check TZVR_mixed
8 TZ_osu graphs found
No data found for TZ_fd.
Tonzi Z-cam data