
Field Notes
<--2014-11-13 09:30:00 | 2014-12-09 09:00:00-->Phenocam link: Searching...
Tonzi: 2014-11-26 09:40:00 (DOY 330)
Author: Siyan Ma
Others:
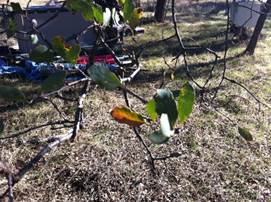
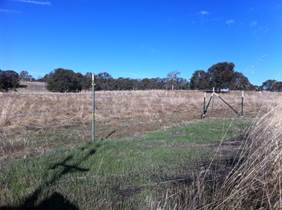
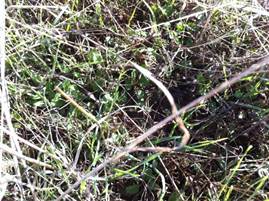
Summary: Grass germinated, still oak leaves at Vaira, fixed Tonzi tower fence, no 7500 analog data at Floor - digital okay, standard field work.
|
When: Date: 11/26/2014 , Day: 330 , Watch Time: 9:40 am . Where: Tonzi/Vaira Ranch Who: Siyan Weather: clear, sunny Phenology: grasses germinated; oak leaves still on at Vaira; no cows at both sites; met Mr. Tonzi’s family members; they went out to cut trees, driving Mr. Tonzi’s red car.
Summary
Vaira_Grass Site
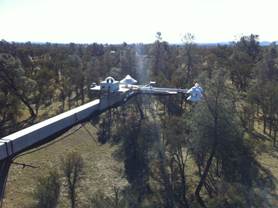
Tonzi_Tower Site
Is the pump running‌ YES!
9. closed gate and set up fence. YES! Toniz_Floor Site
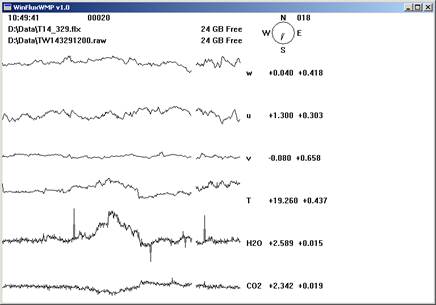
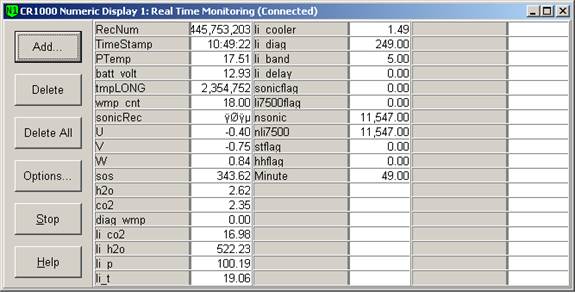
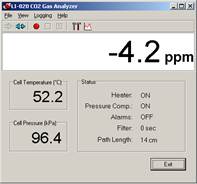
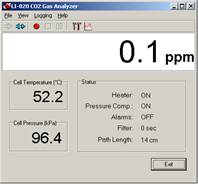
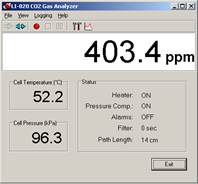
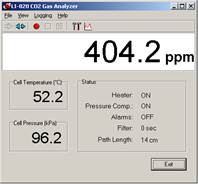
Problem: the Licor-7500 analog channels didn’t connect properly but digital channels seem okay 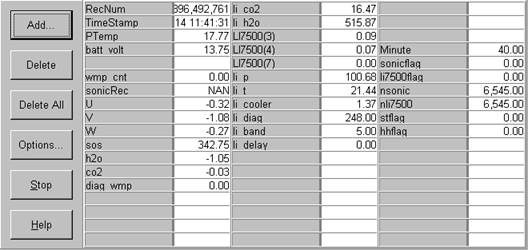 After I did dis- and re-connection, the readings went to normal. 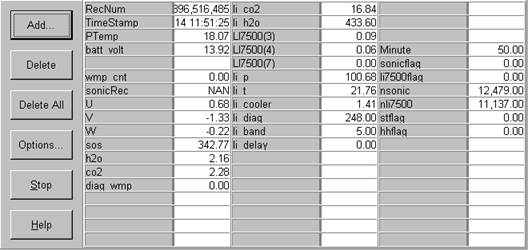
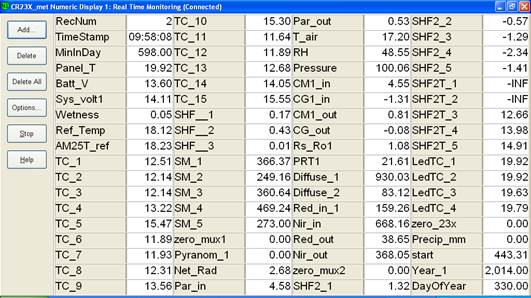
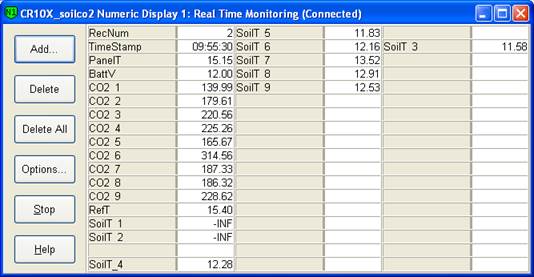
CR23X3 – floor-Met CR23X6 – tower-Met CR10X2 – floor-Met Soil CO2 profile: CR23X5 – soil CO2 profile    
|
Field Data
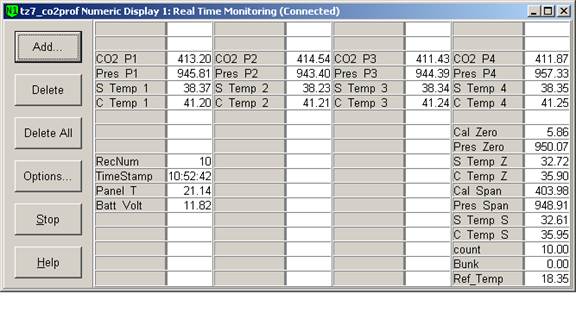
CO2 Profile Tanks
| Date | Tank | Pressure (psi) | ppm |
|---|---|---|---|
| 2014-11-26 | CO2 | 500 | 402.68 |
| 2014-11-26 | N2 | 1500 | 0 |
Well Depth
| Date | Location | Depth (feet) |
|---|---|---|
| 2014-11-26 | TZ_floor | 32.3 |
| 2014-11-26 | TZ_road | 40 |
| 2014-11-26 | TZ_tower | 37 |
mode = both
Moisture Point Probes TZ
Array
(
[0] => Tower_1
[1] => Floor_South_1
[2] => Floor_West_1
[3] => SoilCO2_1
[4] => Soil_Transect_4_1
[5] => Soil_Transect_3_1
[6] => Soil_Transect_2_1
[7] => Soil_Transect_1_1
[8] => SoilCO2_West_A_1
[9] => SoilCO2_West_B_1
[10] => SoilCO2_West_C_1
[11] => Tower_2
[12] => Floor_South_2
[13] => Floor_West_2
[14] => SoilCO2_2
[15] => Soil_Transect_4_2
[16] => Soil_Transect_3_2
[17] => Soil_Transect_2_2
[18] => Soil_Transect_1_2
[19] => SoilCO2_West_A_2
[20] => SoilCO2_West_B_2
[21] => SoilCO2_West_C_2
[22] => Tower_3
[23] => Floor_South_3
[24] => Floor_East_3
[25] => Floor_West_3
[26] => SoilCO2_3
[27] => Soil_Transect_4_3
[28] => Soil_Transect_3_3
[29] => Soil_Transect_2_3
[30] => Soil_Transect_1_3
[31] => SoilCO2_West_A_3
[32] => SoilCO2_West_B_3
[33] => SoilCO2_West_C_3
[34] => Floor_South_4
[35] => Floor_East_4
[36] => Floor_West_4
[37] => SoilCO2_4
[38] => Soil_Transect_4_4
[39] => Soil_Transect_3_4
[40] => Soil_Transect_2_4
[41] => Soil_Transect_1_4
[42] => SoilCO2_West_A_4
[43] => SoilCO2_West_B_4
[44] => SoilCO2_West_C_4
[45] => Tower_4
)
| Date | DOY | Rep | Depth | Tower_1 |
Floor_South_1 |
Floor_West_1 |
SoilCO2_1 |
Soil_Transect_4_1 |
Soil_Transect_3_1 |
Soil_Transect_2_1 |
Soil_Transect_1_1 |
SoilCO2_West_A_1 |
SoilCO2_West_B_1 |
SoilCO2_West_C_1 |
Tower_2 |
Floor_South_2 |
Floor_West_2 |
SoilCO2_2 |
Soil_Transect_4_2 |
Soil_Transect_3_2 |
Soil_Transect_2_2 |
Soil_Transect_1_2 |
SoilCO2_West_A_2 |
SoilCO2_West_B_2 |
SoilCO2_West_C_2 |
Tower_3 |
Floor_South_3 |
Floor_East_3 |
Floor_West_3 |
SoilCO2_3 |
Soil_Transect_4_3 |
Soil_Transect_3_3 |
Soil_Transect_2_3 |
Soil_Transect_1_3 |
SoilCO2_West_A_3 |
SoilCO2_West_B_3 |
SoilCO2_West_C_3 |
Floor_South_4 |
Floor_East_4 |
Floor_West_4 |
SoilCO2_4 |
Soil_Transect_4_4 |
Soil_Transect_3_4 |
Soil_Transect_2_4 |
Soil_Transect_1_4 |
SoilCO2_West_A_4 |
SoilCO2_West_B_4 |
SoilCO2_West_C_4 |
Tower_4 |
Avg | Spacial Count |
Measurement Count |
|---|---|---|---|---|---|---|---|---|---|---|---|---|---|---|---|---|---|---|---|---|---|---|---|---|---|---|---|---|---|---|---|---|---|---|---|---|---|---|---|---|---|---|---|---|---|---|---|---|---|---|---|---|
| 2014-11-26 | 330 | 0 | nan | 15.8 | 11.2 | 15.6 | 11.1 | 9.1 | 30.9 | 10.6 | 10 | 15 | 15.3 | 9.7 | 6.8 | 9 | 10.6 | 13.6 | 27.7 | 21.3 | 13.3 | 3.8 | 14.2 | 5.4 | 15.2 | 14.5 | 6.7 | 11.2 | 11.5 | 3.4 | 17.6 | 11.1 | 16.2 | 12.9 | 14.5 | 16.2 | 12.6 | 9.3 | 11.6 | 14.5 | 11 | 10.7 | 19.6 | 15.6 | 10.2 | 13.6 | 8.7 | 14.8 | ||||
| 2014-11-26 | 330 | 1 | nan | 15.9 | 11.1 | 31.2 | 14.7 | 6.3 | 12.4 | 21 | 15.8 | 14.5 | 3.4 | 31.1 | 14.5 | 19.6 | 13.9 | 11.1 | ||||||||||||||||||||||||||||||||||
| 2014-11-26 | 330 | Avg | 0-15cm | 0 | 0 | |||||||||||||||||||||||||||||||||||||||||||||||
| 2014-11-26 | 330 | Avg | 15-30cm | 0 | 0 | |||||||||||||||||||||||||||||||||||||||||||||||
| 2014-11-26 | 330 | Avg | 30-45cm | 0 | 0 | |||||||||||||||||||||||||||||||||||||||||||||||
| 2014-11-26 | 330 | Avg | 45-60cm | 0 | 0 |
mode = both
Moisture Point Probes VR
Array
(
[0] => Solar_Panels_1
[1] => Flux_Tower_1
[2] => Biomass_Cage_1
[3] => Solar_Panels_2
[4] => Flux_Tower_2
[5] => Gate_2
[6] => Biomass_Cage_2
[7] => Solar_Panels_3
[8] => Flux_Tower_3
[9] => Gate_3
[10] => Biomass_Cage_3
[11] => Solar_Panels_4
[12] => Flux_Tower_4
[13] => Gate_4
[14] => Biomass_Cage_4
)
| Date | DOY | Rep | Depth | Solar_Panels_1 |
Flux_Tower_1 |
Biomass_Cage_1 |
Solar_Panels_2 |
Flux_Tower_2 |
Gate_2 |
Biomass_Cage_2 |
Solar_Panels_3 |
Flux_Tower_3 |
Gate_3 |
Biomass_Cage_3 |
Solar_Panels_4 |
Flux_Tower_4 |
Gate_4 |
Biomass_Cage_4 |
Avg | Spacial Count |
Measurement Count |
|---|---|---|---|---|---|---|---|---|---|---|---|---|---|---|---|---|---|---|---|---|---|
| 2014-11-26 | 330 | 0 | nan | 11.8 | 11.6 | 4.2 | 13.3 | 10.9 | 11.9 | 11.2 | 13.7 | 2.6 | 15.9 | 12 | 25.7 | 11 | 6.9 | 13.3 | |||
| 2014-11-26 | 330 | 1 | nan | 11.2 | 11.5 | 4.2 | 13.3 | 11.5 | 11.8 | 11.2 | 13.7 | 2.5 | 16.6 | 12.3 | 24.8 | 11 | 62 | 13 | |||
| 2014-11-26 | 330 | Avg | 0-15cm | 0 | 0 | ||||||||||||||||
| 2014-11-26 | 330 | Avg | 15-30cm | 0 | 0 | ||||||||||||||||
| 2014-11-26 | 330 | Avg | 30-45cm | 0 | 0 | ||||||||||||||||
| 2014-11-26 | 330 | Avg | 45-60cm | 0 | 0 |
No TZ grass heigth found
Grass Height VR 6
| Date | Height reps (cm) | Location | Average | Samp | STDEV | |||||
|---|---|---|---|---|---|---|---|---|---|---|
| 2014-11-26 | 5 | 3 | 3 | 5 | 5 | 3 | GH_ALL | 4 | 6 | 1 |
Tree DBH
| Date | Tag# | Reading (mm) |
|---|---|---|
| 2014-11-26 | 1 | 11.1 |
| 2014-11-26 | 102 | 7.6 |
| 2014-11-26 | 2 | 11.3 |
| 2014-11-26 | 245 | 18.4 |
| 2014-11-26 | 3 | 10.0 |
| 2014-11-26 | 4 | 8.6 |
| 2014-11-26 | 5 | 11.3 |
| 2014-11-26 | 7 | 9.1 |
| 2014-11-26 | 72 | 19.0 |
| 2014-11-26 | 79 | 13.5 |
| 2014-11-26 | 8 | 12.7 |
No water potential data found
No TZ Grass Biomass data found
No TZ OakLeaves Biomass data found
No TZ PineNeedles Biomass data found
0 photos found
16 sets found
No data found for TZ_Fenergy.
11 TZ_tmet graphs found
11 TZ_soilco2 graphs found
Can't check TZ_mixed
3 TZ_mixed graphs found
1 TZ_fflux graphs found
8 TZ_fmet graphs found
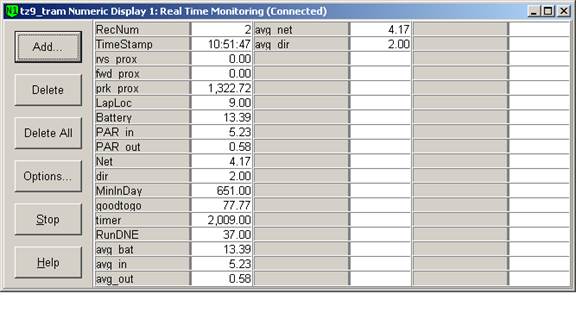
1 TZ_tram graphs found
3 TZ_co2prof graphs found
No data found for TZ_irt.
No data found for TZ_windprof.
1 TZ_tflux graphs found
2 TZ_sm graphs found
Can't check TZ_met
1 TZ_met graphs found
Can't check TZVR_mixed
8 TZ_osu graphs found
No data found for TZ_fd.
Tonzi Z-cam data