
Field Notes
<--2014-06-05 15:00:00 | 2014-06-17 15:00:00-->Other sites visited today: Sherman Island | Mayberry | West Pond | East End | Twitchell Alfalfa
Phenocam link: Searching...
Twitchell Rice: 2014-06-12 12:40:00 (DOY 163)
Author: Sara Knox
Others: Joe, Kathleen, Madeline
Summary: Weeds in the field seem to be dying. Regular fieldwork and data download. Replaced pressure sensor. Installed LED sensors but didn’t wire in data logger. HMP45 wires were loose. Power issues (camera only collected 3 days of pictures).
| Twitchell Rice 2014-06-12 We arrived about 12:40 PDT. Sunny and warm with a nice breeze. The field is finally flooded. The rice continues to grow but the weeds seem to be dying (must have been sprayed with herbicide). I Checked the tower and downloaded data. Kathleen measured vegetation height, Madeline cleaned sensors, and Joe replaced bolts on the boardwalk but was unable to fix the boardwalk. Now that the field is flooded we should add a DO sensor. Joe noticed that the wires for the HMP45 were loose and he was easily able to pull them out of the datalogger. The wires looked all chewed up so Joe clipped the ends and re-stripped the wires. All looked good after re-wiring the sensor. When I was downloading the camera images, I noticed that we must have lost power around 5/31/2014 since only three days worth of pictures were saved since the last data download. Check the data to look for power issues. Joe added LED sensors to the tower but since the computer was running out of battery we decided not to wire the sensors to the datalogger or uploaded the new Met program since we wanted to save the battery to downloaded data at alfalfa. Will have to do that next week. Replaced the pressure sensor since values were funky. We replaced PTB110 sn E1330045 with sn H0160093. 7500 readings: CO2 = 393.3 ppm (396 after cleaning) H2O = 540 mmol m-3 (502 after cleaning) signal strength = 80.66% (81.31% after cleaning) p = 101.73 kPa t = 21.93 C sos: 346.47 m s-1 7700 readings: CH4 = 1.86 ppm (same after cleaning) RSSI = 48% (71% after cleaning) Met ok. Cleaned Rad. |
Veg Height (cm): Tape measure from ground to top of plant - Was originally recorded as inches so converted to cm
17, 17, 15, 18, 18, 20, 20, 18, 18, 17, 14, 20, 20, 20, 15, 20, 23, 23, 20, 18, avg = 18.6, stdev = 2.39
1 photos found
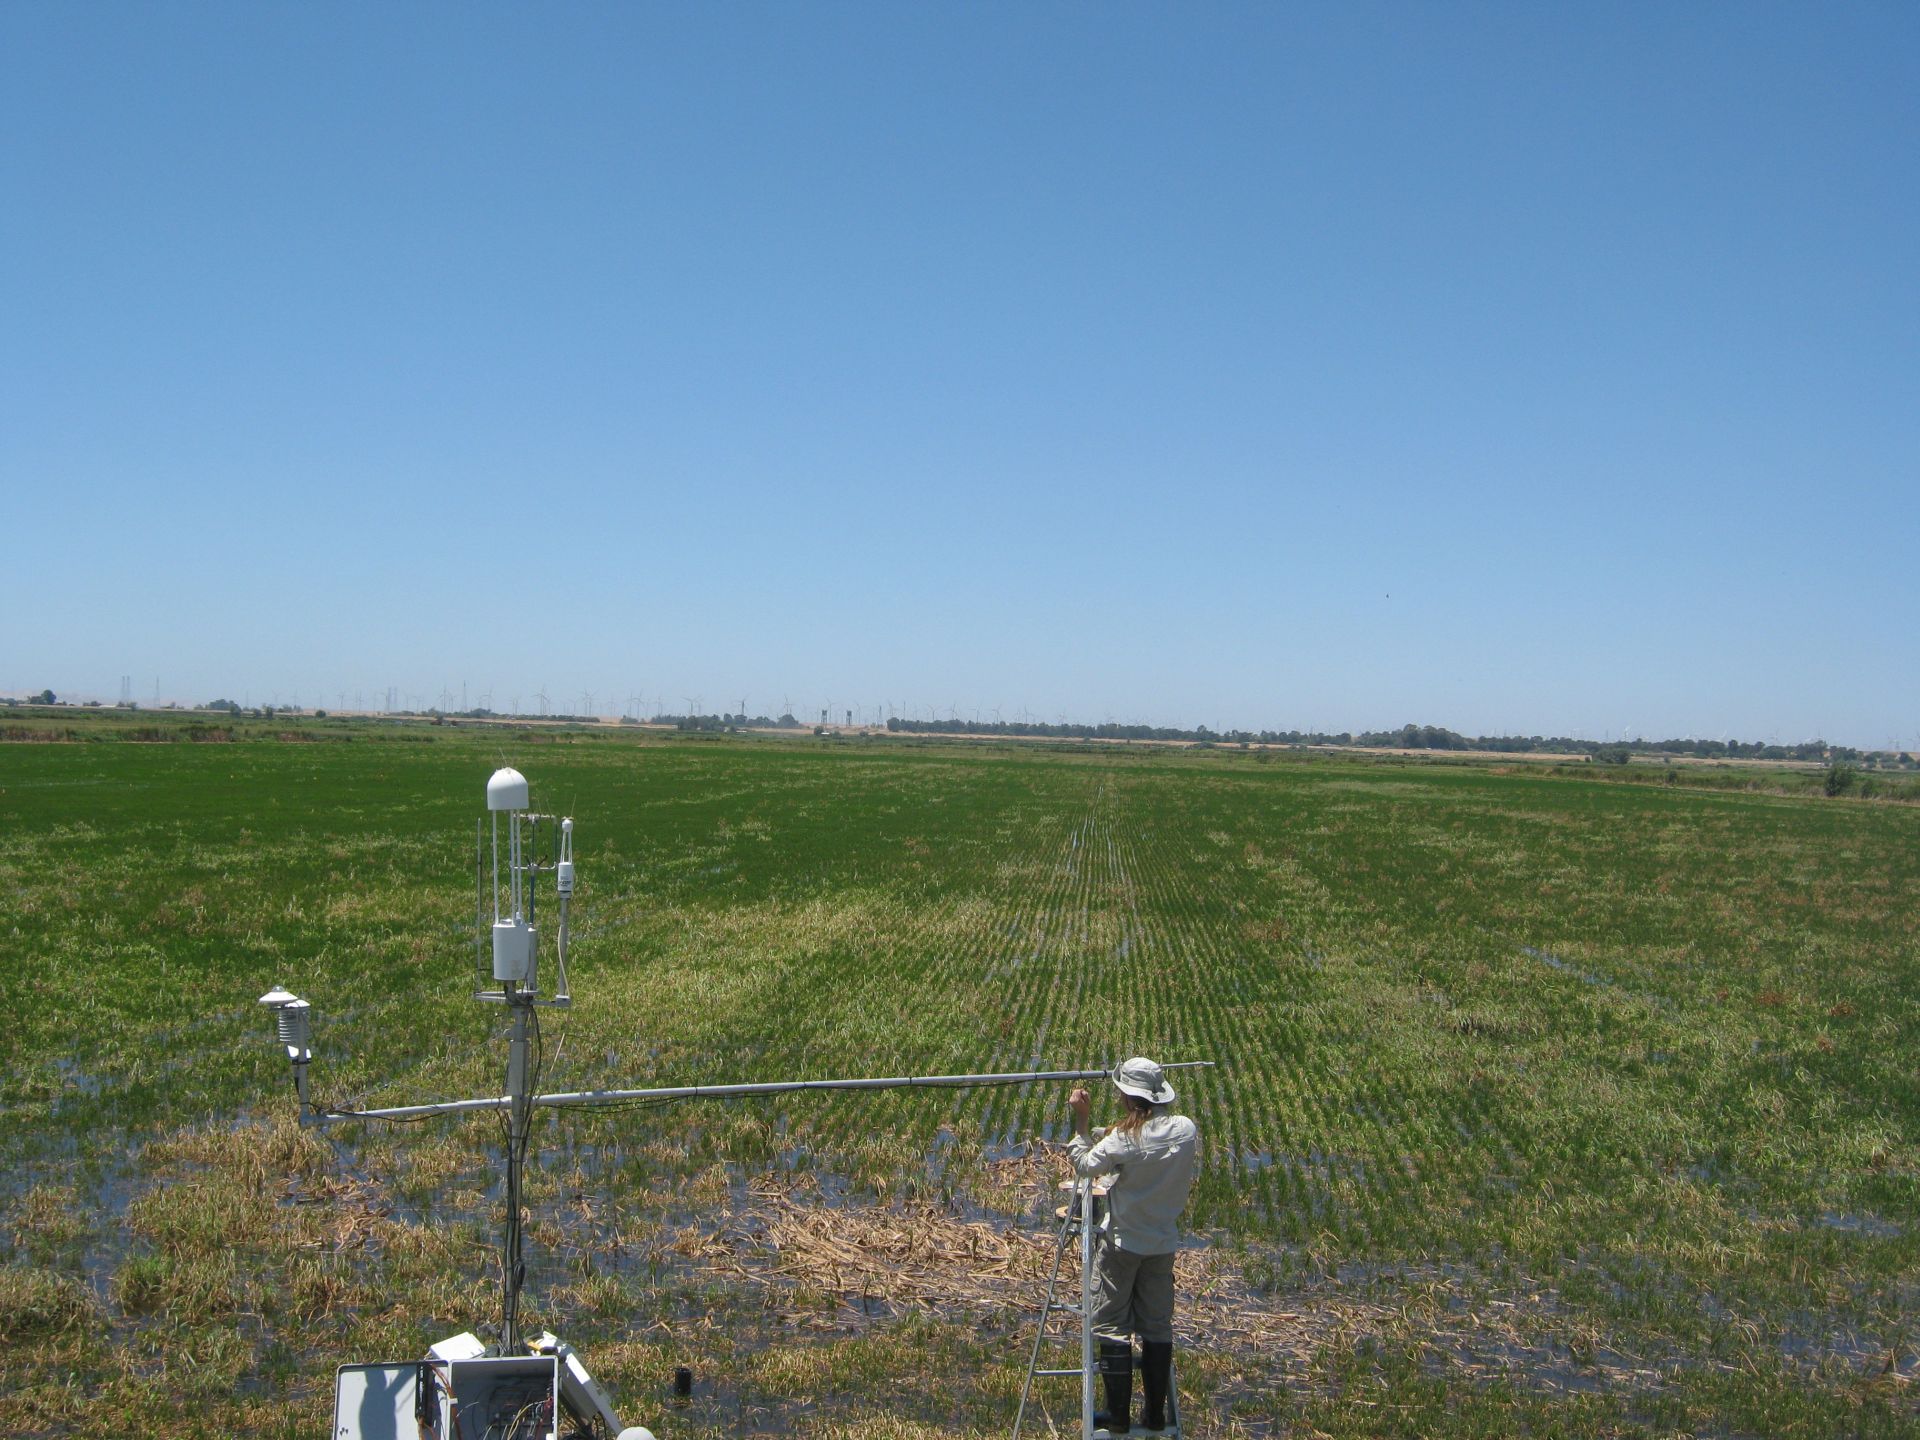
TW_autocam_20140612_1215.jpg ( 2014-06-12 12:15:02 ) Full size: 1920x1440
Joe on site installing LED sensor
6 sets found
12 TW_met graphs found
5 TW_flux graphs found
Can't check TWSI_mixed
Can't check SIMBTWEE_met
1 TW_cam graphs found
Can't check TATWBABCSB_cam