
Field Notes
<--2024-10-29 10:30:00 | 2024-12-03 11:00:00-->Other sites visited today: Vaira
Phenocam link: Searching...
Tonzi: 2024-11-15 11:00:00 (DOY 320)
Author: Joe Verfaillie
Others: Kuno
Summary: Ana Maria installing psychrometers, Kuno doing bole flux, power problems at north bole temp set fixed, DIY washer kit for Floor 7700, collected dendrometers, pulled some coax, phenocam images missing.
| Tonzi 2024-11-15 Kuno and I arrived at about 11:00 PST. Ana Maria and her husband were about 20min behind us. It is a cold and partly sunny day. There was a little fog lower in the valley. There has been a little rain in the last week - just enough to knock down the dust. The trees are much browner and I didn't see any sprouting grass yet. Kuno did his rounds of tree trunk and soil collar fluxes. He tightened up the IRT cross arm on the west bole temperature set. A wasp had filled that IRT port with mud and larva. I cleaned it out a best I could with a stick. Some Q-tips would be better next time. Kuno also used the tree corer to bore holes in the trees and measured high values of CH4 being released from inside the trees. The east and west bole temperature sets were fine with full data and nearly full battery packs. The north one had a nearly empty battery pack and was missing some data from the last day or so. The solar panel only seemed to be producing about 10V. I tried to run 12V from the Floor tower but it was only about 11.5V at the box. So I ran 24V from the tower to the DC-DC converted the solar panel was using. This seemed to work but the DC-DC converter over heated (probably trying to recharge the battery) and shorted out. Finally I just ran 12V directly to that data logger and all seemed well. I also ran a 12V line from the Floor tower box to Ana Maria's sensors to the northeast. This has its own DC-DC converter which might have saved things as she initially had a short in her line. I think she installed two psychrometers and has plans for more and some sap flow sensors. They will be back in a week to install more. They left two large Campbell enclosures full of stuff at the main tower. I think I will extend the cow fence to encircle all of this equipment. I pulled out a section of the old MD9 coax cable from the road to the Floor tower to use the conduit for Ana Maria's stuff and the power line to the north bole temp set. The coax cable will go in the trash. I added a DIY wash reservoir and spray head to the 7700 on the Floor tower. It worked, but I should write up some notes separately to document what worked and what didn't. I collected the Floor flux and well data. Floor 7500 read: 421.7ppm CO2, 436.4mmol/m3 H2O, 10.6C, 99.0kPa, 94.1SS After cleaning: 445.6ppm CO2, 364.0mmol/m3 H2O, 10.7C, 99.0kPa, 100.4SS Floor 7700 read: 2.02ppm CH4, 54.0RSSI - 77.3 after cleaning I read the dendrometers, measured the soil moisture, collected the FD data, serviced the zcams, did the well readings (missed the Floor well) and collected the TOMST and HISE point dendrometer data. The TOMST medpine dendrometer had a data hiccup from 8/21 to 8/28 - maybe a full download will recover it. HISE dendrometer 2 has a bunch of drop outs starting 8/31 at 6:00am - maybe the cable is loose. At the tower top I moved the wash box up to the top railing and used a hose clamp mount to secure it. With some longer tubing I could move the box back down to the level below. I also swapped out the teal Ethernet cable from the 7700 to the 7550. The first one a super stiff connector and a crack in its outer jacket. We might be able to use in the lab for calibrations. Afterwards all seemed well and the spray and spin worked. I collected the Flux data Tower 7500 read: 434.0ppm CO2, 373.9mmol/m3 H2O, 13.3C, 98.8kPa, 100.4SS - 101.4 after cleaning Tower 7700 read: 2.11ppm CH4, 69.6RSSI - 74.1 after cleaning The phenocam card was empty. I had Windows check it and it said it repaired it. I put it back in the CR1000, manually ran the phenocam script from the camera and made sure new images were recorded. The battery box on the UC Davis trailer was open, uncovered and wet inside. I let it dry in the sun while we were there and then closed it and tucked the trap in around it again. I let Troy know by text. We left at about 16:00 PST |
Field Data
No tank data
Well Depth
| Date | Location | Depth (feet) |
|---|---|---|
| 2024-11-15 | TZ_road | 37.7 |
| 2024-11-15 | TZ_tower | 34.35 |
| 2024-11-15 | VR_well | 60 |
No TZ Moisture Point data found
No VR Moisture Point data found
No TZ grass heigth found
No VR grass heigth found
Tree DBH
| Date | Tag# | Reading (mm) |
|---|---|---|
| 2024-11-15 | 102 | 4.1 |
| 2024-11-15 | 2 | 17.1 |
| 2024-11-15 | 245 | 11.1 |
| 2024-11-15 | 3 | 9.2 |
| 2024-11-15 | 4 | 10.5 |
| 2024-11-15 | 5 | 21.2 |
| 2024-11-15 | 6 | 8.9 |
| 2024-11-15 | 7 | 15.7 |
| 2024-11-15 | 72 | 10.3 |
| 2024-11-15 | 79 | 10.9 |
No water potential data found
No TZ Grass Biomass data found
No TZ OakLeaves Biomass data found
No TZ PineNeedles Biomass data found
4 photos found
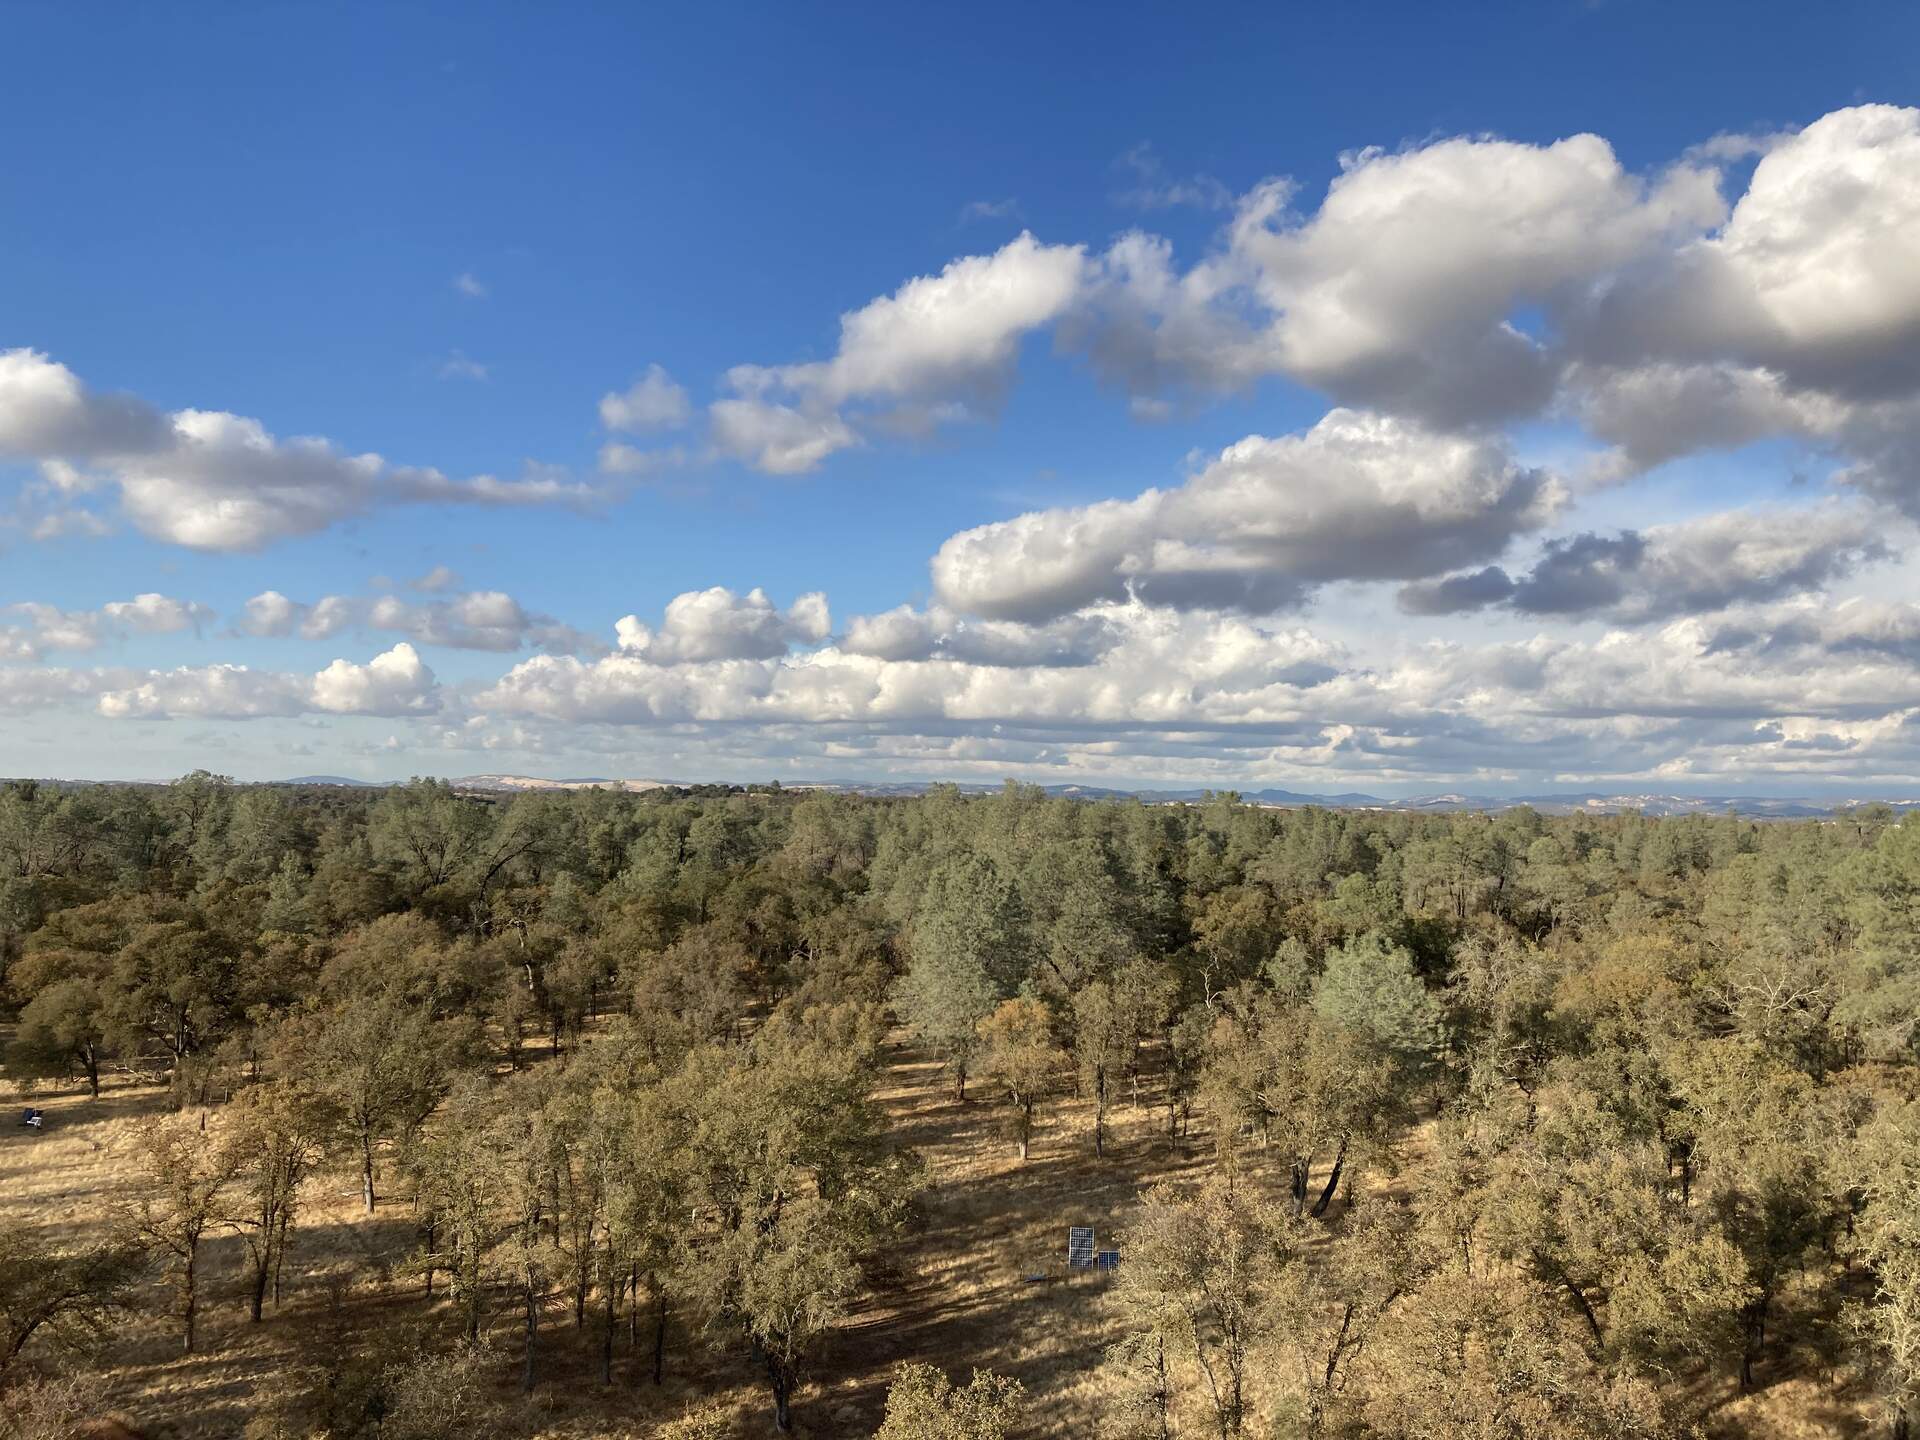
20241115TZ_CloudsFallWoodland.jpg ( 2024-11-15 15:26:51 ) Full size: 1920x1440
Puffy clouds over the autumn oak woodland
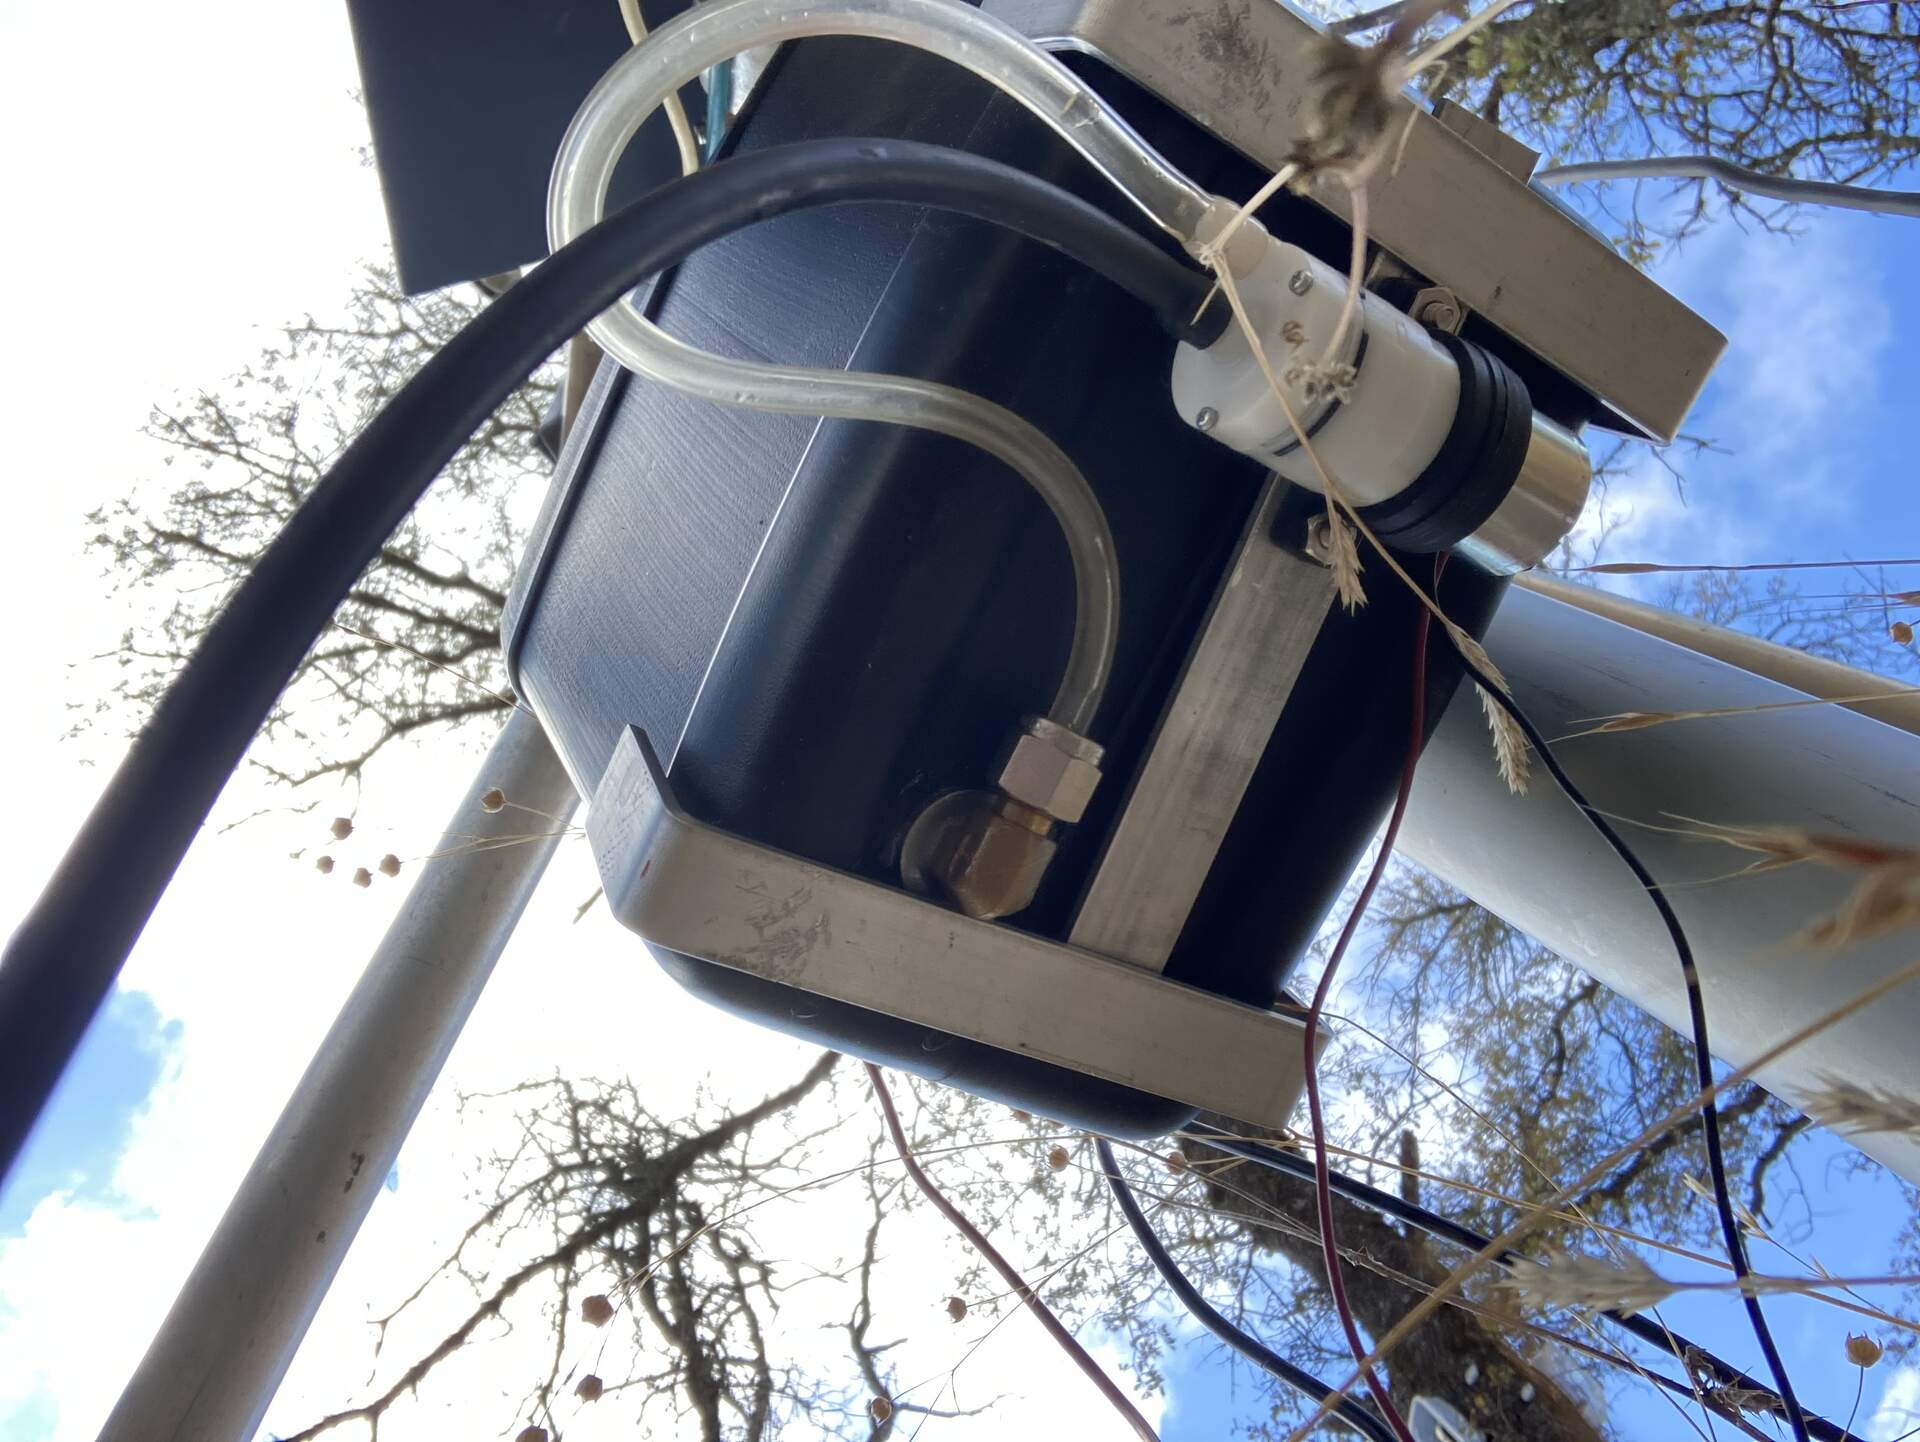
20241115TZ_DIYWashPump.jpg ( 2024-11-15 11:26:33 ) Full size: 1920x1442
Bottom of DIY washer kit showing the pump
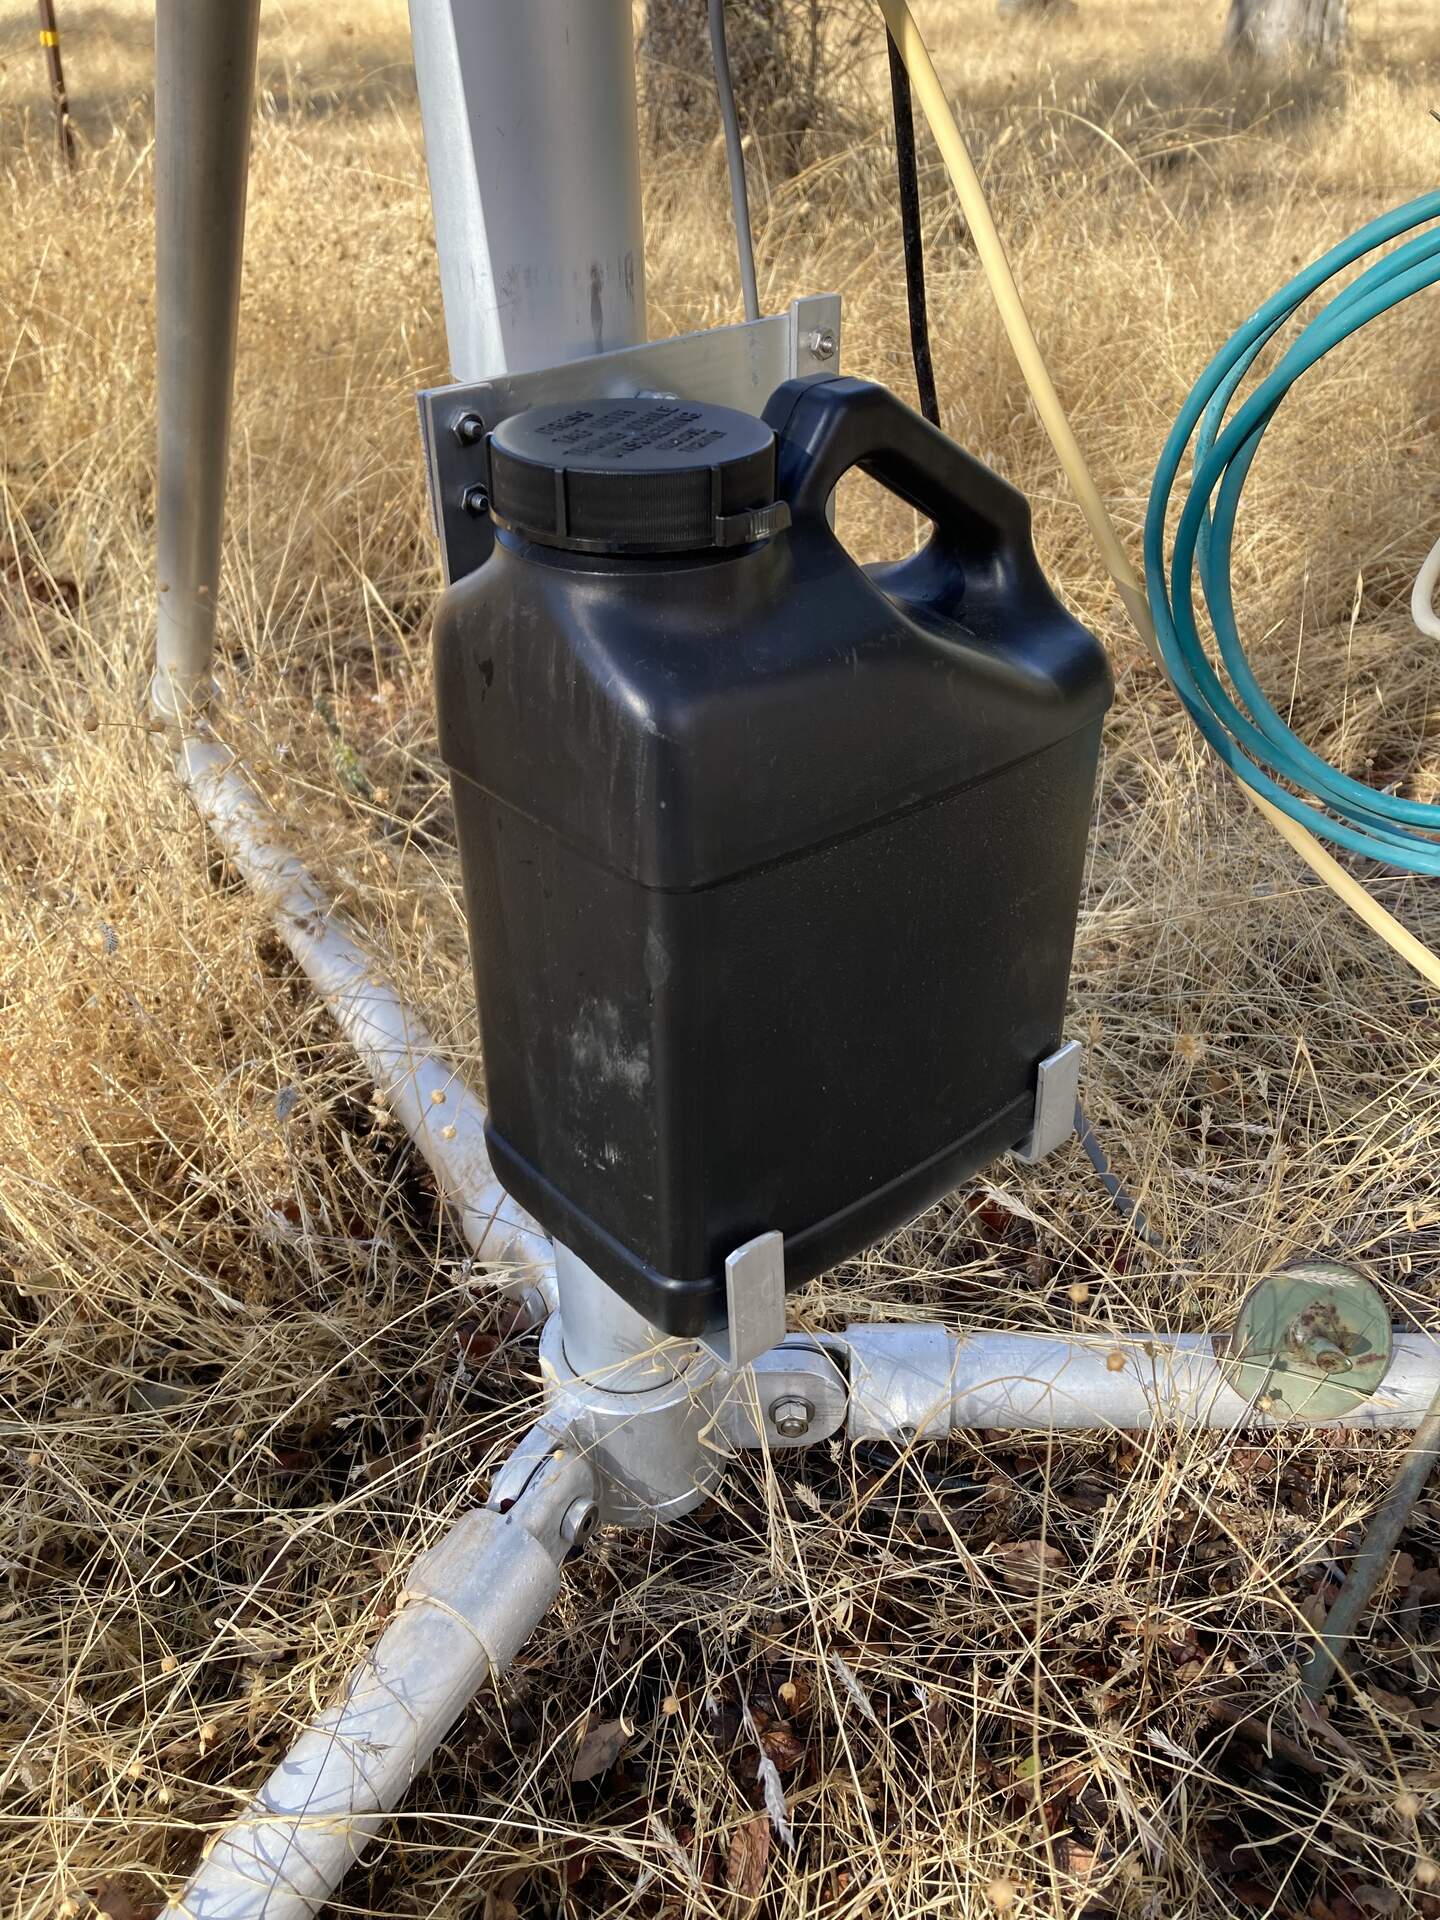
20241115TZ_DIYWashReservoir.jpg ( 2024-11-15 11:08:57 ) Full size: 1440x1920
Black plastic jug of the DIY washer kit
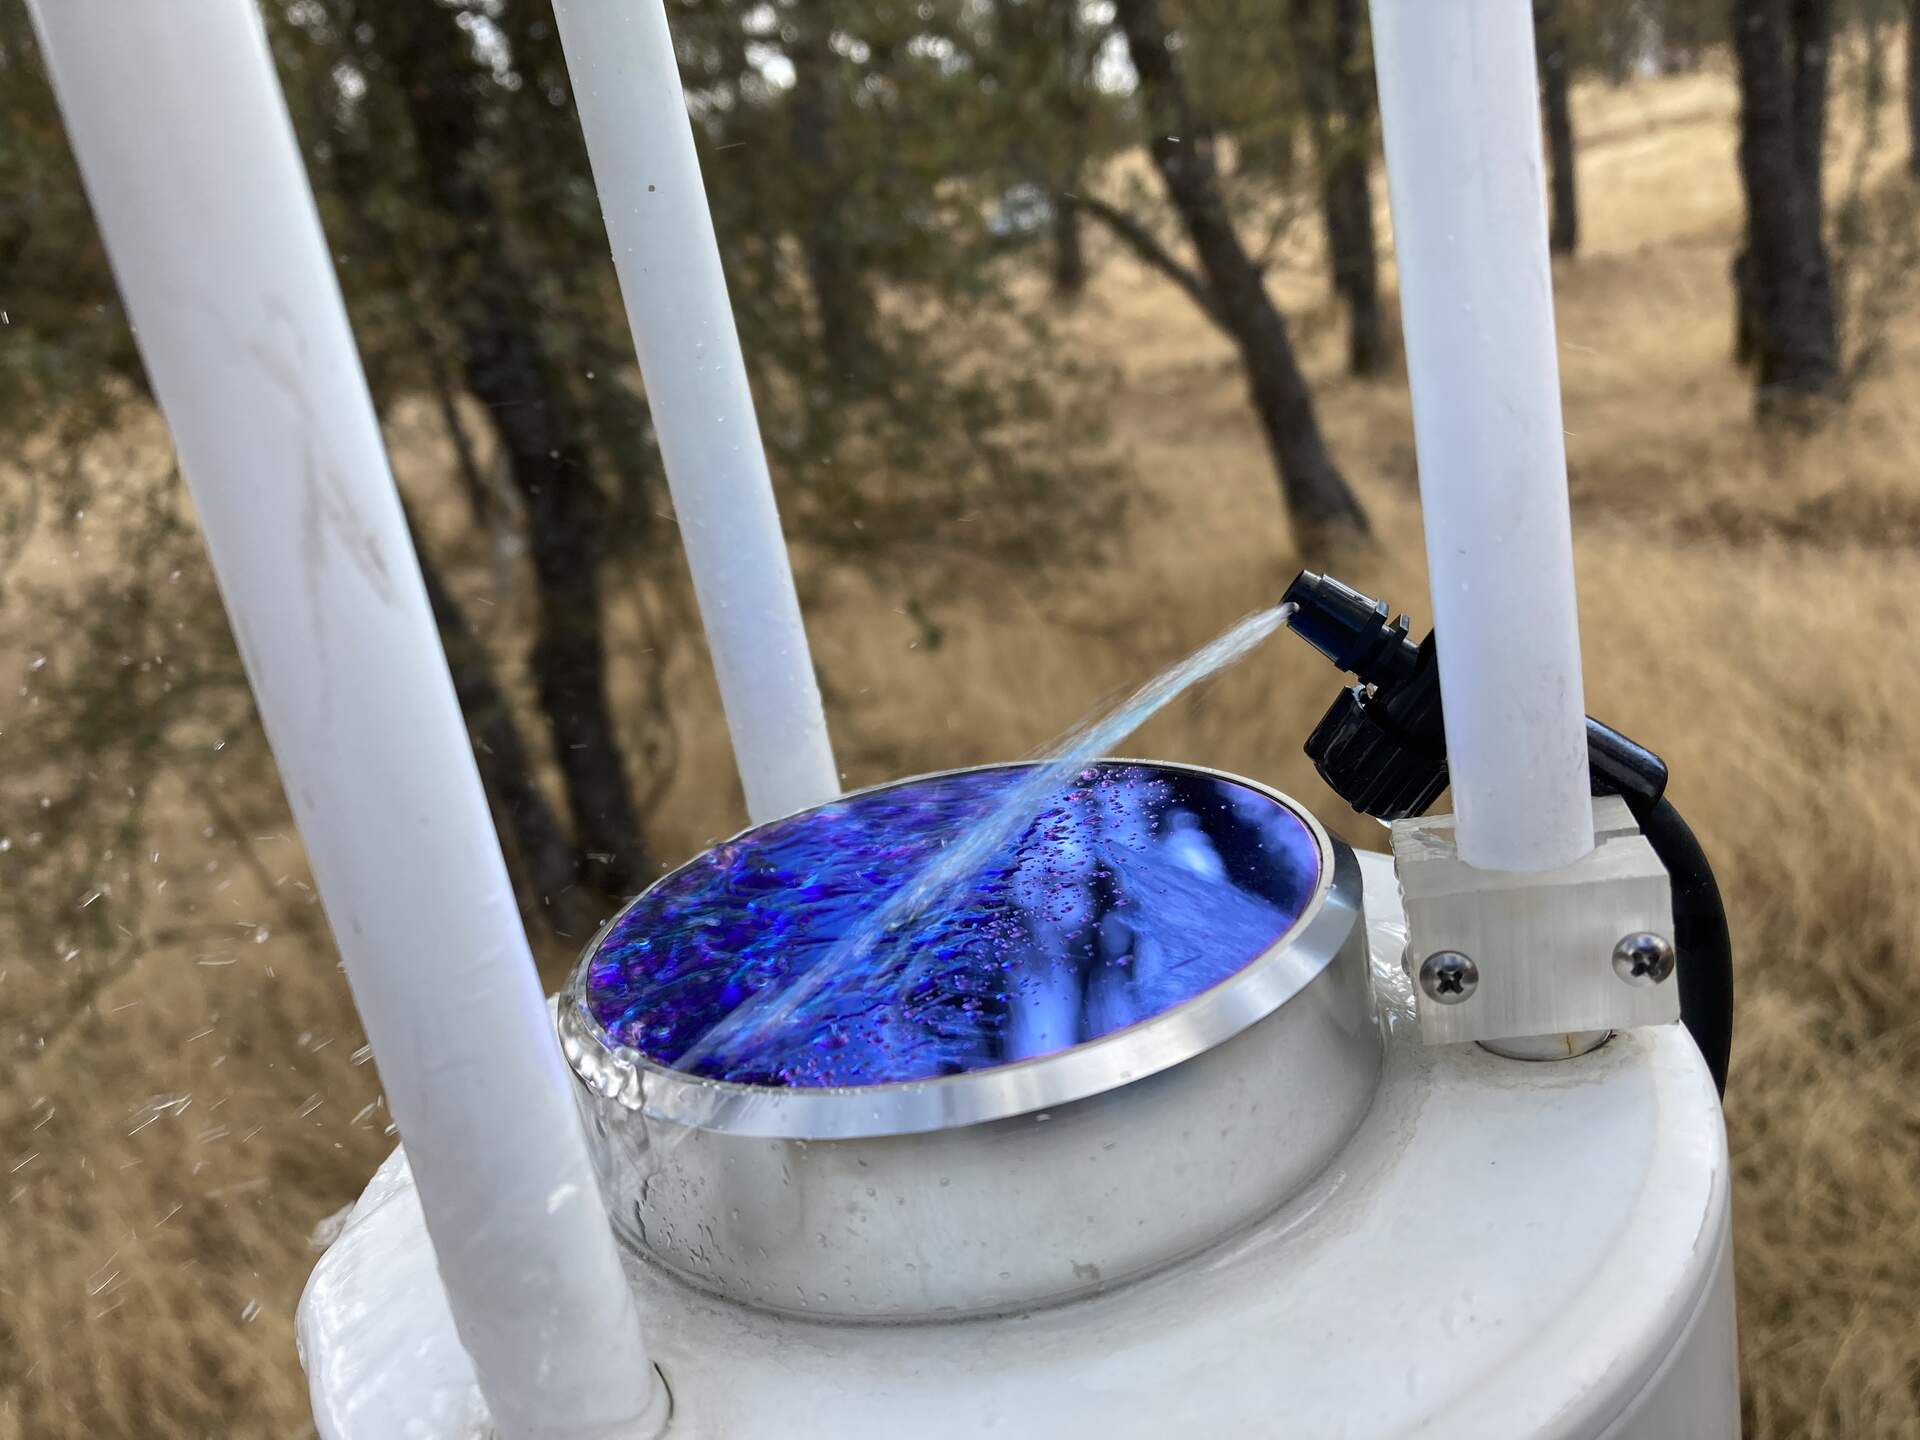
20241115TZ_DIYWashSpray.jpg ( 2024-11-15 11:42:02 ) Full size: 1920x1440
Spray head of the DIY spray kit spraying the 7700 mirror
16 sets found
No data found for TZ_Fenergy.
11 TZ_tmet graphs found
No data found for TZ_soilco2.
Can't check TZ_mixed
3 TZ_mixed graphs found
1 TZ_fflux graphs found
8 TZ_fmet graphs found
No data found for TZ_tram.
3 TZ_co2prof graphs found
1 TZ_irt graphs found
No data found for TZ_windprof.
1 TZ_tflux graphs found
8 TZ_sm graphs found
Can't check TZ_met
1 TZ_met graphs found
Can't check TZVR_mixed
8 TZ_osu graphs found
3 TZ_fd graphs found
Tonzi Z-cam data