Field Notes
<--2014-06-05 14:15:00 | 2014-06-17 13:30:00-->Other sites visited today: Sherman Island | Mayberry | West Pond | East End | Twitchell Rice
Phenocam link: Searching...
Twitchell Alfalfa: 2014-06-12 14:00:00 (DOY 163)
Author: Sara Knox
Others: joe, Kathleen, Madeline
Summary: Regular field work. Data. download.
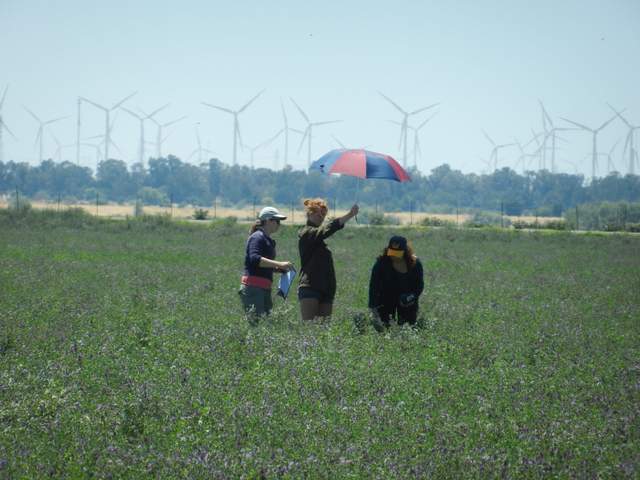
| Twitchell Alfalfa 2014-06-12 We arrived about 14:00 PDT. It was sunny and warm with a nice breeze. The main ditch we drive down was dry this time. The alfalfa is in full bloom and smells great. Joe attended to the tower and downloaded data. We didn’t en up swaping the LED sensor since the computer was almost dead and we wanted to make sure we were able to collect data first. Joe collected all the data in the nick of time! Kathleen and Madeline did LAI. Since it was close to noon and the sun was nearly directly ahead, it was hard to shade the LAI 2000 with the umbrella. Since the umbrella was sometimes directly in the view of the LI 2000 lens, we took a few extra measurements this week after readjusting how we held the umbrella as to not influence the readings. Therefore there are 13 readings this week instead of 11. I forgot to bring the frame for the clip plots so no clip plots this week. I did veg height transect instead. Met ok. Trampled grass around solar panels. |
Veg Height (cm): Tape measure from ground to top of plant
55, 68, 60, 54, 49, 55, 70, 48, 42, 46, 65, 66, 70, 65, 70, 62, 63, 79, 64, 42, avg = 59.7, stdev = 10.34
2 photos found

20140612TA_LAI.jpg ( 2014-06-12 14:14:41 ) Full size: 1920x1440
Sara and other measuring leaf area

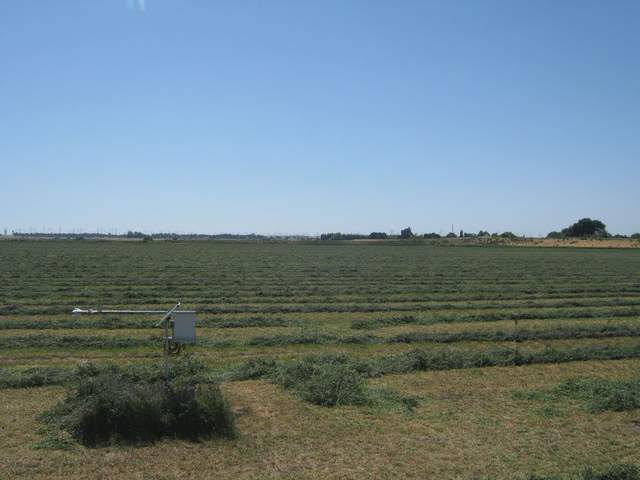
TA_autocam_20140613_1445.jpg ( 2014-06-13 14:45:02 ) Full size: 1920x1440
Mowed
7 sets found
Can't check TA_met
11 TA_met graphs found
Can't check TA_rad
3 TA_rad graphs found
Can't check TA_flux
5 TA_flux graphs found
Can't check TA_soilco2
7 TA_soilco2 graphs found
No data found for TA_arable.
1 TA_cam graphs found
Can't check TATWBABCSB_cam

