Field Notes
<--2024-11-06 08:53:00 | 2024-12-04 07:05:00-->Other sites visited today: Mayberry | East End | Bouldin Corn | Bouldin Alfalfa | Hill Slough
Phenocam link: Searching...
Gilbert Tract: 2024-11-19 10:10:00 (DOY 324)
Author: Daphne Szutu
Others: Arman
Summary: Installed three sets of litter bags with azolla, cleaned camera window, storms coming later this week
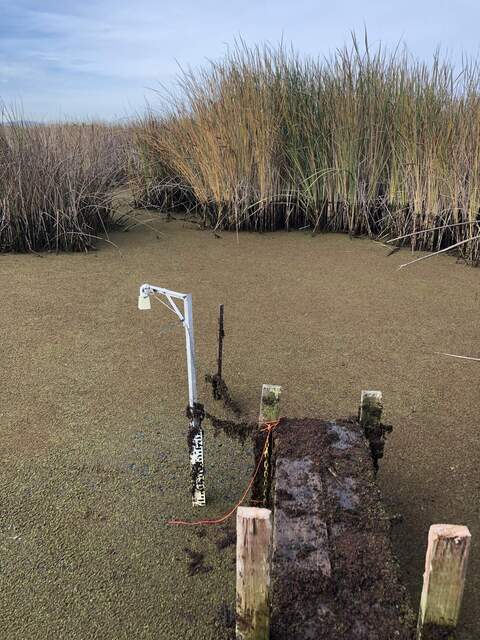
| 2024-11-19 Gilbert Tract Arman and I arrived at 10:10 PST. It was cold, overcast, and still. We had some rain last week and storms coming in tomorrow and Friday. The tide was ebbing and the staff gauge read 59cm at 10:13 PST. Arman got started with installing three sets of litter bags in the wetland. Kuno and Robert were interested in how fast azolla would decompose. Last month, Kuno collected some azolla from Gilbert Tract and dried it with the oven in the lab. He packaged the dried azolla into about 15 small mesh bags and weighed the bags. The bags were then grouped into larger mesh bags, which were tied to fiberglass rods. There are three rods with about 5 small mesh bags each. Arman pounded the rods into the ground by the boardwalk so that the bags are about 30cm above the soil - they should remain flooded even during low tide. Bright orange mason's line ties each rod to the boardwalk so we can retrieve them in a month or so to dry and weigh. I measured the surface water conductivity. Surface, 830 uS, 9.0 C At the tower, there were some sleepy wasps in the met box that I ferried out. I downloaded met, cam, and USB GHG data. Arman cleaned flux and rad, topped off the reservoir (it had been 90% full), and cleaned a little detritus out of the precip bucket funnel. There were no files on the Song Meter Micro card because it had run out of batteries. I swapped in three lithium batteries from "slightly used" bag in the lab. I connected to the recorder with my phone, was prompted to sync its location, and saw that the new batteries are at 100%. Arman and I cleaned the camera window inside and out. There seem to be some scratches or something where the lens is that we couldn't remove. The view angle might have changed a little. 7500 read: 436ppm CO2, 328mmol/m3 H2O, 11.7C, 102.0kPa, 98SS--99 after cleaning 7700 read: 2.12ppm CH4, 54RSSI – 83 after cleaning We got to the channel at 11:10 PST. The water was unusually clean and I could clearly see the white body of the channel miniDOT. There were 2 people fishing from a boat just outside of the yellow barrier. I showed Arman how to download the ADCP and CR6 data. We set the ADCP clock (it was 2 seconds behind) and restarted data logging. We left at 11:26 PST. We removed the upper boardwalk for storm prep. |
1 photos found

20241119GT_Boardwalk.jpg ( 2024-11-19 10:33:41 ) Full size: 1440x1920
Installed 3 sets of azolla in mesh bags for Kuno's decomposition experiment. They are installed low enough to remain submerged during low tide. The profiles are marked with the bright orange mason string.
8 sets found
Can't check MBWPEESWGT_mixed
Can't check MBEEWPSWEPGT_cam
16 GT_met graphs found
4 GT_flux graphs found
3 GT_adcp graphs found
1 GT_cam graphs found
2 GT_usgs graphs found
2 GT_chanexo graphs found

