Field Notes
<--2014-06-05 09:30:00 | 2014-06-17 09:30:00-->Other sites visited today: Mayberry | West Pond | East End | Twitchell Rice | Twitchell Alfalfa
Phenocam link: Searching...
Sherman Island: 2014-06-12 09:50:00 (DOY 163)
Author: Sara Knox
Others: Joe, Kathleen, Madeline
Summary: Pepperweed continues to dry out. Standard field work and downloaded data. HMP45 fan dead.
| Sherman 2014-06-12 We arrived around 9:50 PDT. It was sunny, quite windy, and warm. The pepperweed continues to dry out, and the field now looks quite brown. I attended to the tower and downloaded data while Madeline did soil respiration and vegetation height measurements, Kathleen did LAI and moisture point, Joe did well depth and checked out the box and power for the Picarro / Forerunner chamber test. Joe noticed the HMP45 fan was dead but didn't have a fan to replace it. Need a fan to swap in next time. Madeline noticed a Vaisala probe lying on the ground near profile B (sn G0150035) – looks like it was the one that was replaced last week. LGR readings: 1.86 ppm, 09:59, 22.26 C, 137.94 Torr (adjusted to 143.7 Torr), 14.73 us, 10 Hz 7500 readings: CO2: 16.47 mmol m-3 (same after cleaning) H2O: 552 mmol m-3 (same after cleaning) P = 100.14 kPa T = 22.61 C Diag: 249 (same after cleaning) Soil CO2 ok. Met ok. Cleaned radiation sensors. |
Veg Height (cm): Tape measure from ground to top of plant - pepperweed mostly dried out.Grass dry.
60, 70, 70, 55, 70, 80, 50, 70, 90, 75, 60, 50, 70, 95, 80, 65, 85, 95, 60, 75, avg = 71.3, stdev = 13.46
2 photos found

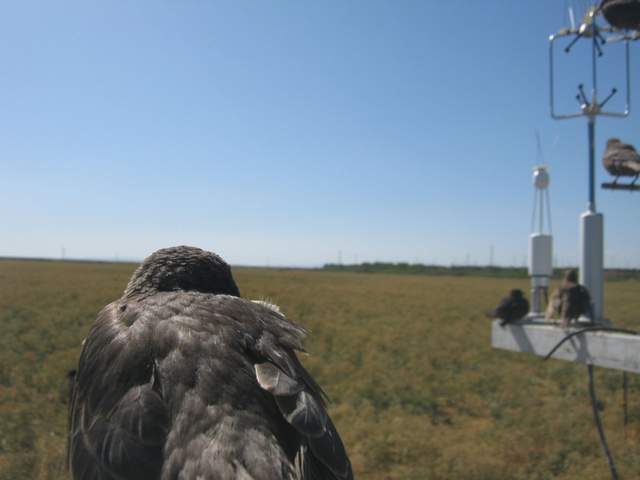
SI_autocam_20140613_1545.jpg ( 2014-06-13 15:45:02 ) Full size: 1920x1440
Starlings on the tower

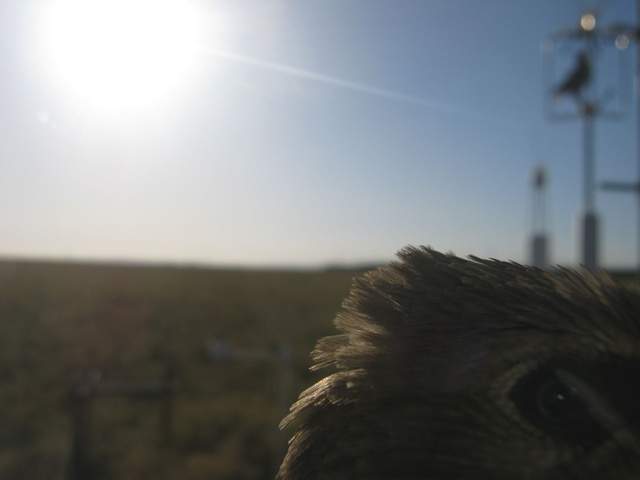
SI_autocam_20140613_1745.jpg ( 2014-06-13 17:45:02 ) Full size: 1920x1440
Birds eye
7 sets found
No data found for SI_mp.
11 SI_met graphs found
Can't check SI_mixed
2 SI_mixed graphs found
4 SI_flx graphs found
4 SI_soilco2 graphs found
Can't check TWSI_mixed
Can't check SIMBTWEE_met

