Field Notes
<--2020-09-10 08:45:00 | 2020-10-22 15:30:00-->Other sites visited today: Bouldin Corn | Bouldin Alfalfa | Mayberry | West Pond | East End
Phenocam link: Searching...
Sherman Wetland: 2020-10-05 11:15:00 (DOY 279)
Author: Daphne Szutu
Others:
Summary: Permanent: Regular data collection/cleaning, water level still super low, found old precip funnel, downloaded globe thermometer data Temporary: Regular data collection/cleaning, wasps galore, picam couldn't restart, swapped HMP fan
| 2020-10-05 Sherman Wetland I arrived at 11:15 PDT. It was a hot and still day with blue skies overhead but hazy horizons. Mt. Diablo is not visible. The Rio Vista EPA AirNow AQI values have been creeping up from around 100 in the morning to around 150 now, between “Unhealthy for Sensitive Groups†and “Unhealthy.†The main gate padlock was stuck half-open when I arrived, but after I whacked it with a wrench handle it seemed ok, if a little sticky. We should keep an eye on it. This site was scheduled to be serviced last week, but I delayed it because of heat and bad air. The wetland is even drier than before. The staff gauge read -19cm (i.e., the water level was 19cm below the bottom of the staff gauge). When I climbed down to measure the water level with a measuring tape, I saw the old precip bucket funnel. It was half-buried in mud, under the boardwalk and pretty much right under the precip bucket. There were wasps buzzing about and lots of cattail fluff everywhere. I left some mothballs in the boxes with the met CR1000 and the dfPAR CR10X. I collected met, camera, USB GHG, and miniDOT data. I swapped the miniDOT and water level sensor desiccant. The wash reservoir was ¾ full; I refilled it. I also downloaded the globe thermometer data and gently cleaned the cattail fluff and spiderwebs off with my fingers. LI-7500 readings: CO2 424ppm H2O 600ppm T 28.4C P 101.7kPa SS 100--> 101 after cleaning LI7700 readings: CH4 2.04 ppm RSSI 43--> 76 after cleaning I left at 12:00 PDT. Back in the lab, I noticed some missing photos on the camera card. I'll try to recuva the files, but we might need to replace the card. 2020-10-05 Sherman Wetland Temporary Tower I arrived at 12:15 PDT. It was a hot and still day with blue skies overhead but hazy horizons. Mt. Diablo is not visible. The Rio Vista EPA AirNow AQI values have been creeping up from around 100 in the morning to around 150 now, between “Unhealthy for Sensitive Groups†and “Unhealthy.†There is a little water in front of (west) of the tower, and the eosGP sensor was just barely in the water. This site was scheduled to be serviced last week, but I delayed it because of heat and bad air. The wasps are becoming a nuisance here. They like to hang out in the datalogger box and the wash reservoir box. I downloaded met and USB GHG. The wash reservoir was 2/3 full; I refilled it. The picam wifi connection kept dying. I opened it and fixed a loose wire on the screw terminal. I downloaded and cleared the data, but then the camera was not connecting anymore. I couldn’t figure out what was wrong, so I brought the picam (sn RPI0W-000) back to the lab to inspect. I swapped the HMP fan, but it needs to be swapped out for a 12V fan after we order more. I cleaned flux and rad sensors. LI-7500 readings: CO2 410pm H2O 614ppm T 28.6C P 101.9kPa SS 95--> 98 after cleaning LI7700 readings: CH4 2.0ppm RSSI 35--> 68 after cleaning I left at 14:00 PDT. |
1 photos found

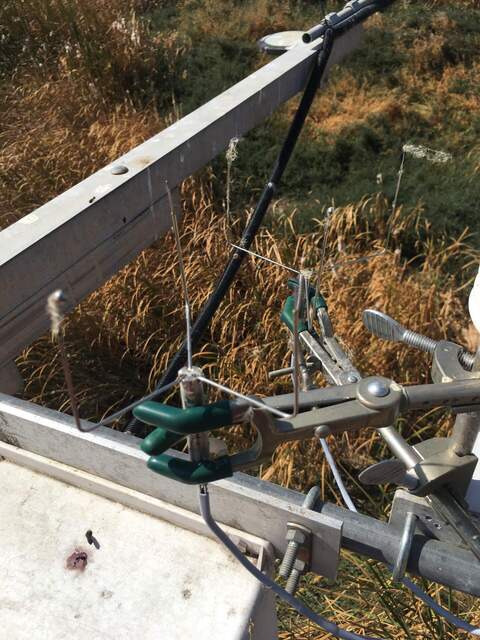
20201005SW_GlobeThermometer.jpg ( 2020-10-05 11:54:08 ) Full size: 1440x1920
Cattail fluff caught on globe thermometers
7 sets found
Can't check MBWPEESWGT_mixed
Can't check MBEEWPSWEPGT_cam
16 SW_met graphs found
4 SW_flux graphs found
Can't check MBSWEEWPBCBA
Can't check SW_Temp
14 SW_Temp graphs found
3 SW_arable graphs found

