
Field Notes
<--2020-08-28 09:50:00 | 2020-10-05 11:15:00-->Other sites visited today: Mayberry | East End | West Pond | Bouldin Corn | Bouldin Alfalfa
Phenocam link: Searching...
Sherman Wetland: 2020-09-10 08:45:00 (DOY 254)
Author: Joe Verfaillie
Others: Daphne
Summary: Moderate air quality, Added globe thermometers, Serviced solar system at temp tower, water level coming up at temp tower maybe the main tower will get some water soon.
| Sherman Wetland
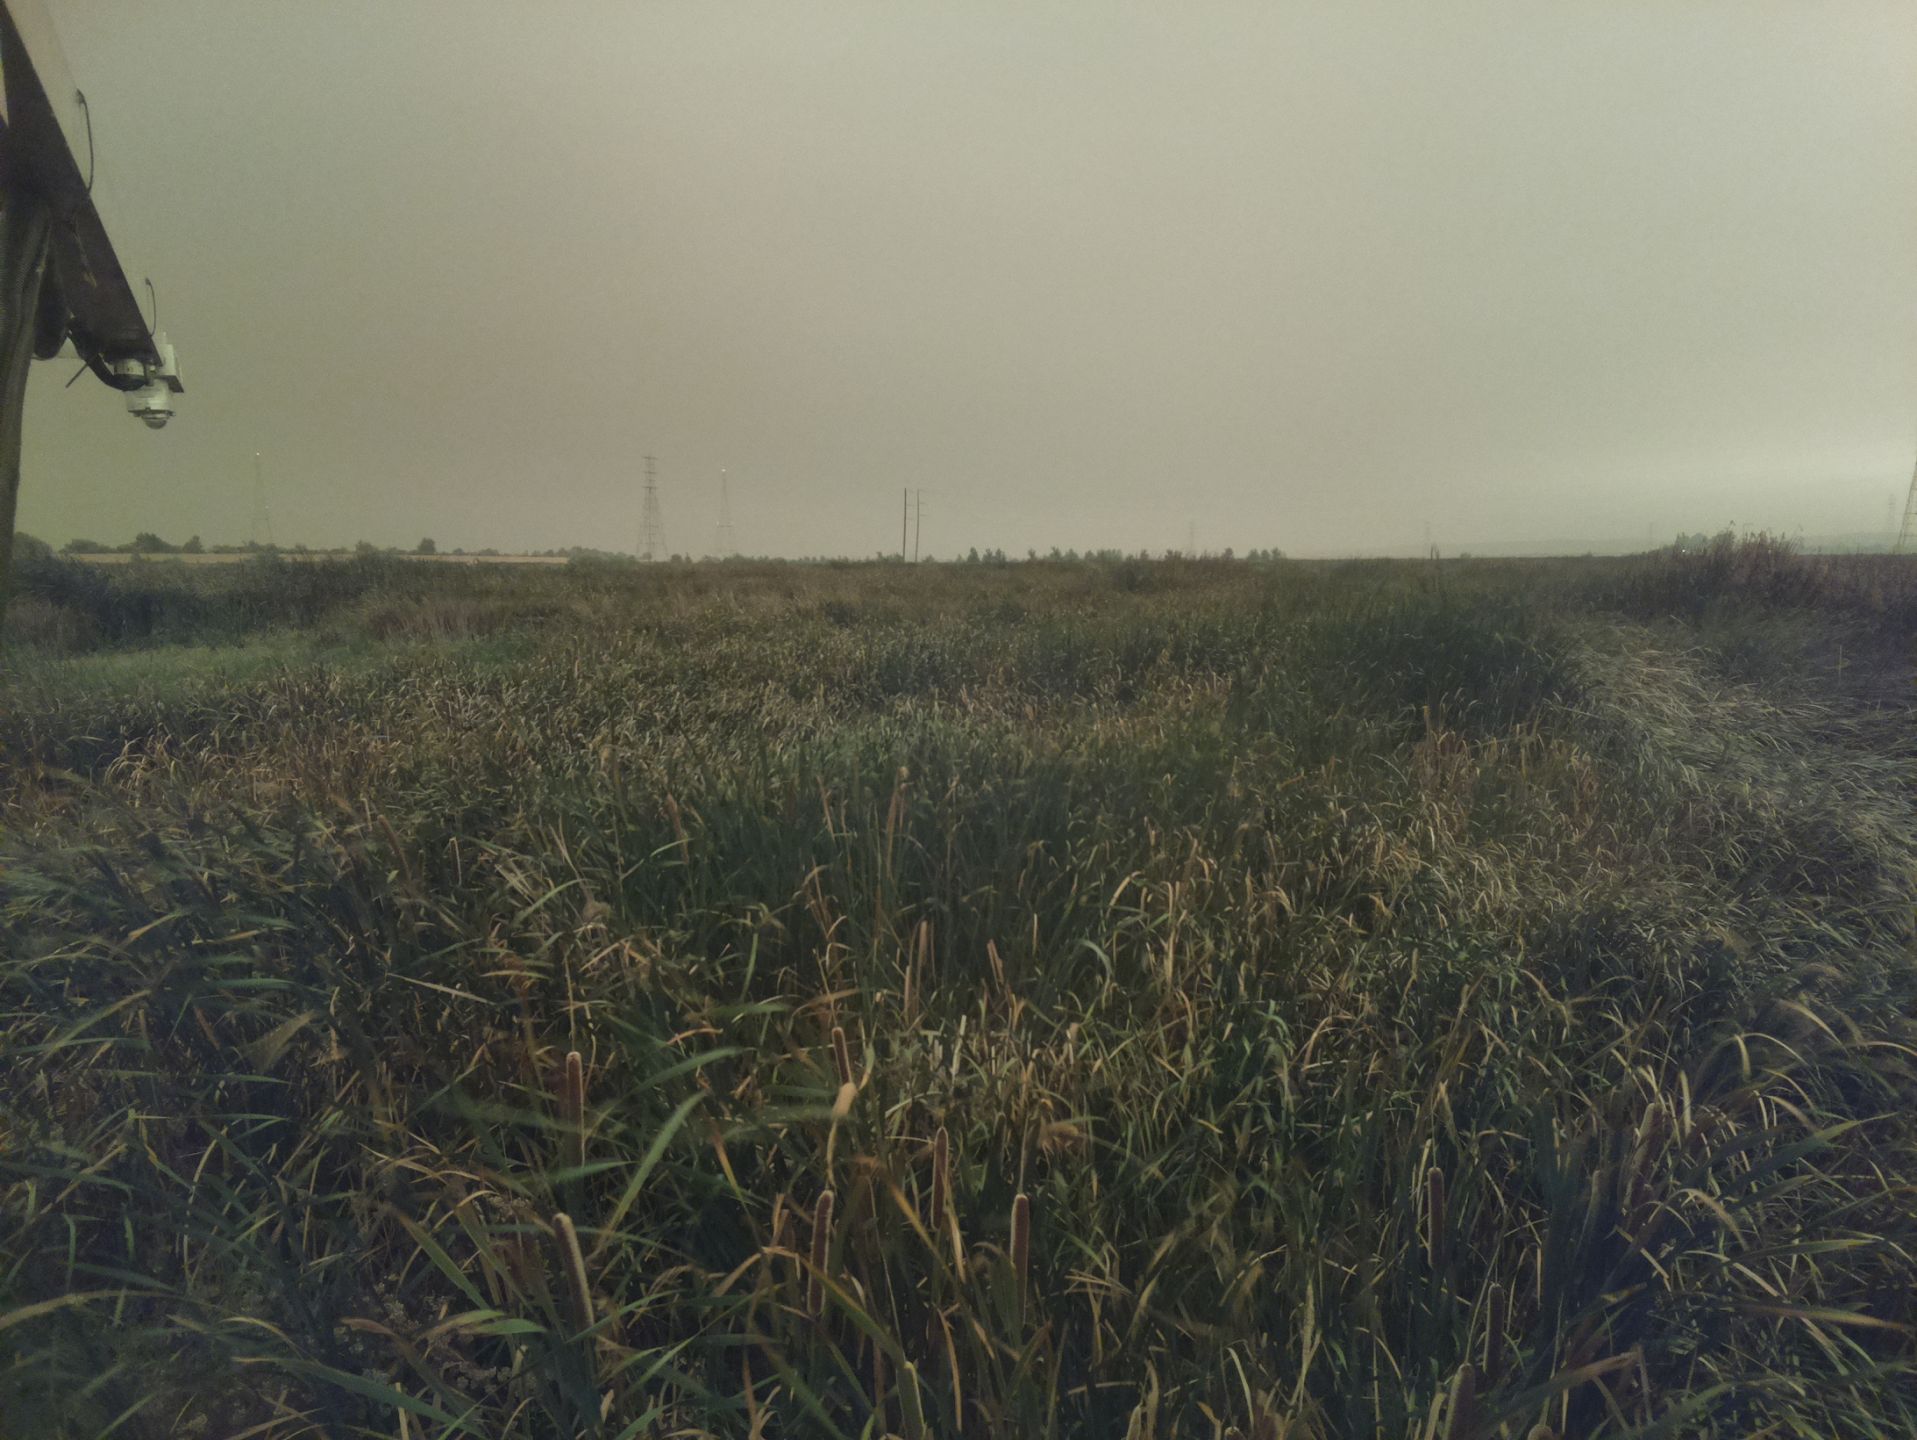
2020-09-10 Daphne and I arrive in separate cars at 8:45 PDT. It was cool and overcast with a cold fresh smelling breeze from the west. There’s smoke higher up as the sun was a red disk in the sky. AQI from Rio Vista, Antioch and Oakley were between 100 and 130 most of the day, but Berkeley was about 150 by 9am and closer to 250 when we returned in the evening. The water level was -8cm – lowest I’ve seen it since construction. The tules and cattails are all brown but some weeds are taking advantage of the exposed ground. The 7500 read: 417ppm CO2, 750mmol/m3 H2O, 16.8C, 101.6kPa, 98SS – 103 after cleaning The 7700 read: 1.95ppm CH4, 43RSSI – 81 after cleaning. The leading edges of the Licors were black with gunk at this and other Sherman Island sites. The wash reservoir was about 80% full –refilled. The radiometers had some ash on them. I installed the two globe thermometers I got from my friend Atsushi Maruyama in Japan. They are on the railing near the radiation boom with the HMP155 sn R0360206 and connected to a CR1000 sn 4190. The globe thermometers are three thermocouples in different size stainless steel spheres (~1mm – 7mm). Combining the three measurements should give actual air temperature without the need of a solar shield or ventilation. Daphne cleaned the solar panels. We left at 9:15 for the temporary site Temporary Tower We arrived at 9:30. There was some water under the tower starting yesterday according to the well level data. The wetland is about 1/3 yellow here. Daphne did the standard data collection while I checked on the solar system to diagnose recent power losses. The 7500 read: 419ppm CO2, 775mmol/m3 H2O, 17.6C, 101.9kPa, 95SS – 97 after cleaning The 7700 read: 2.03ppm CH4, 32RSSI – 73 after cleaning. The leading edges were dark with gunk. At the solar panels there were a bunch of wasps in the charge controller box which I evicted with a stick and left some moth balls for the ones I could not chase out. The screw terminals all seemed tight. I checked the water levels in the battery bank sn BB-SW_Temp1. These batteries are flooded but had a label that was mostly peeling off over screw cap openings that unscrewed best using a quarter (coin). I could see the plates in most of the cells and ended up adding about 1/2 gallon of DI water to each battery. I hope this fixes the problem. We left at 10:15 |
4 photos found
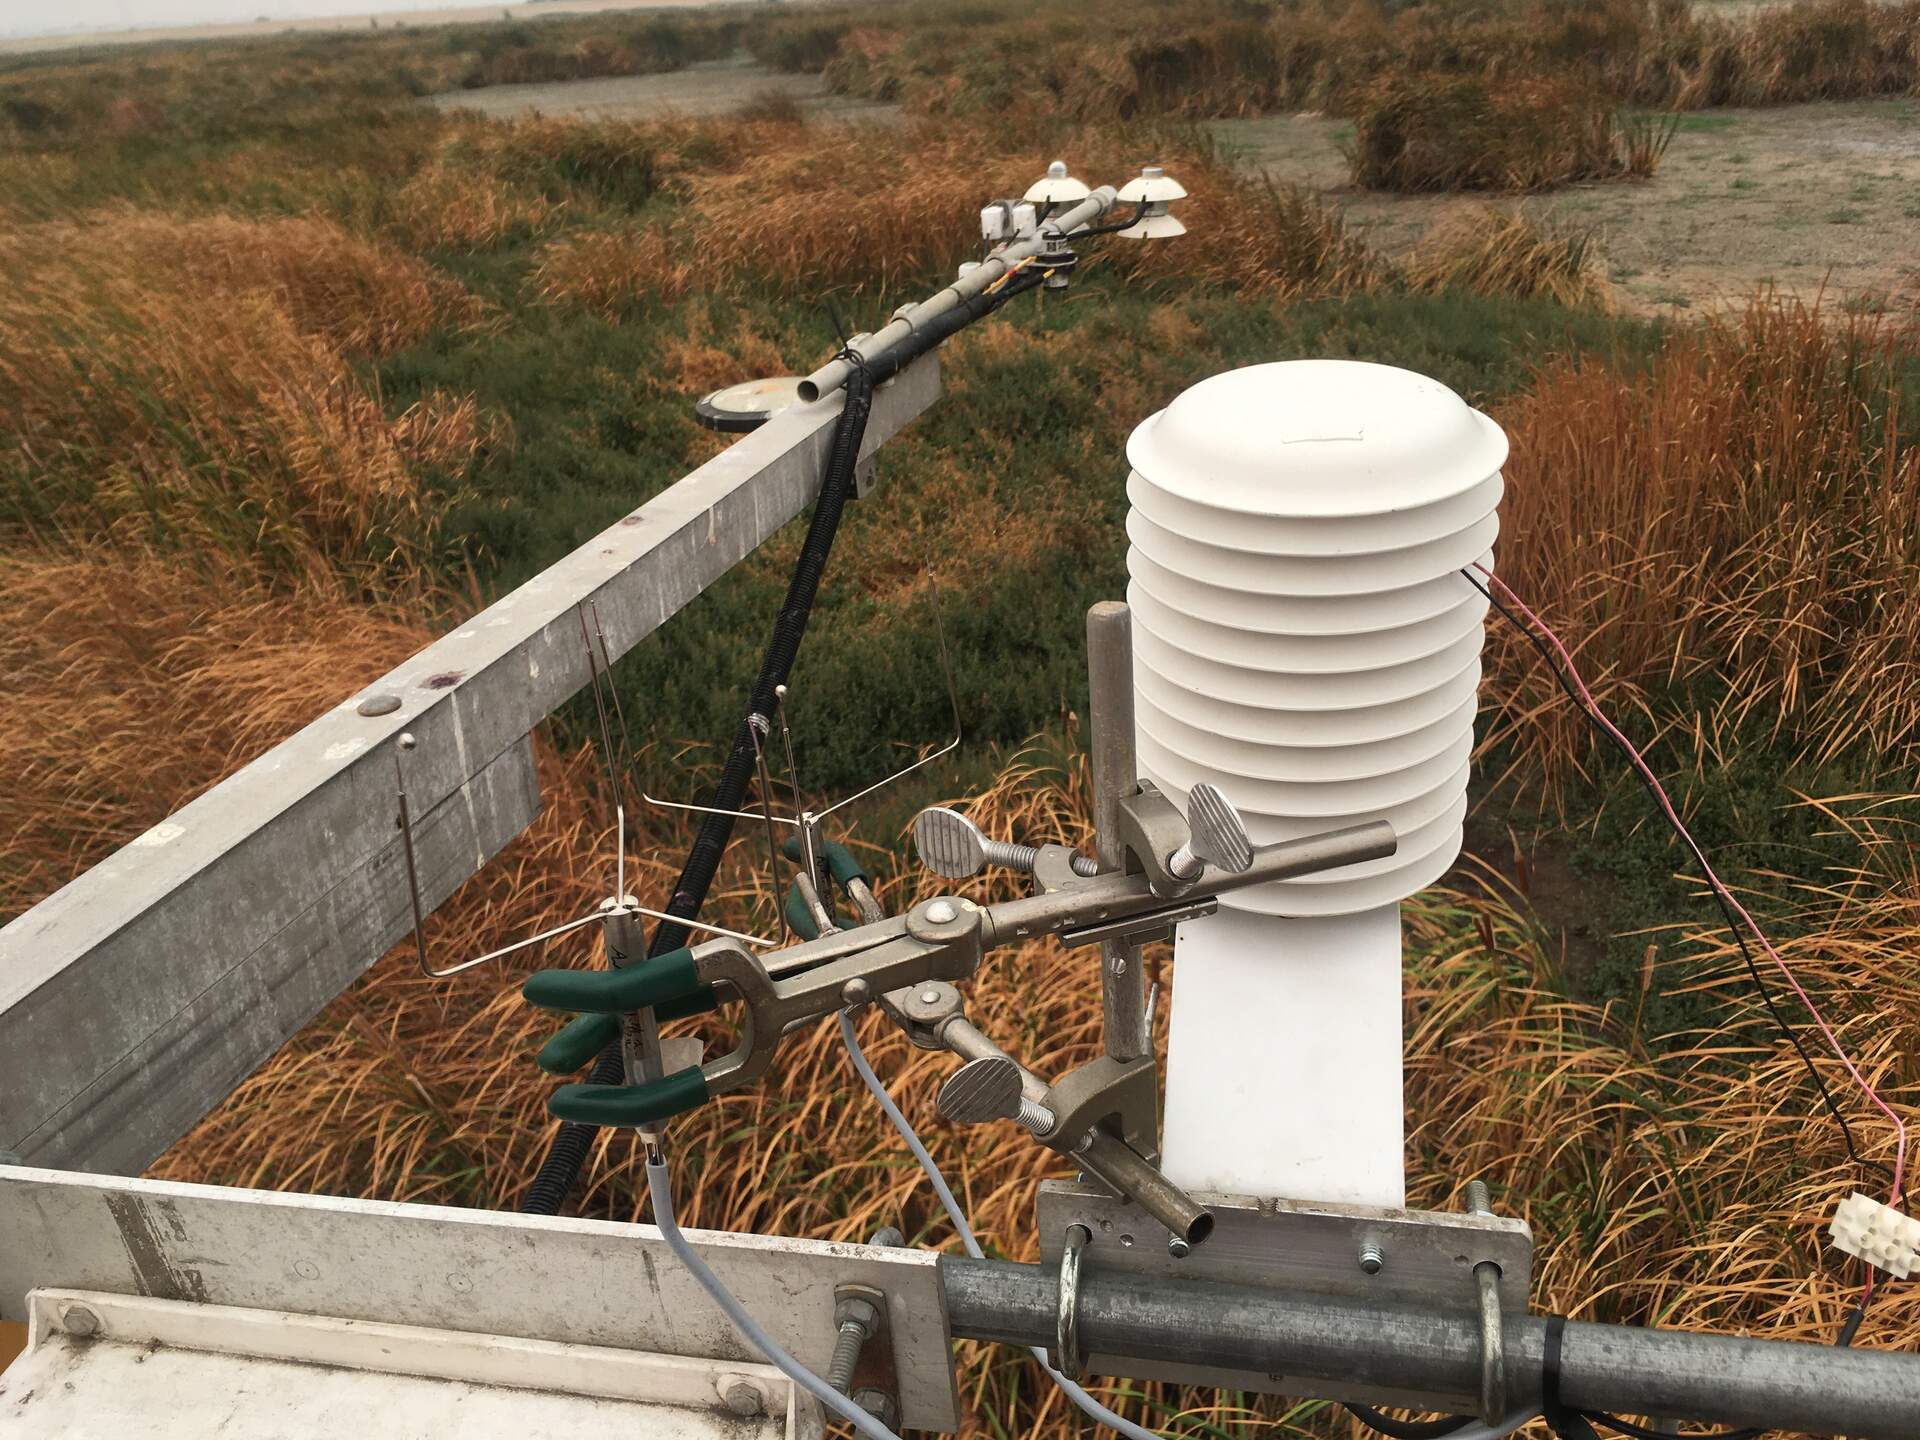
20200910SW_GlobeThermometers.jpg ( 2020-09-10 00:00:00 ) Full size: 1920x1440
Installed globe thermometers for testing
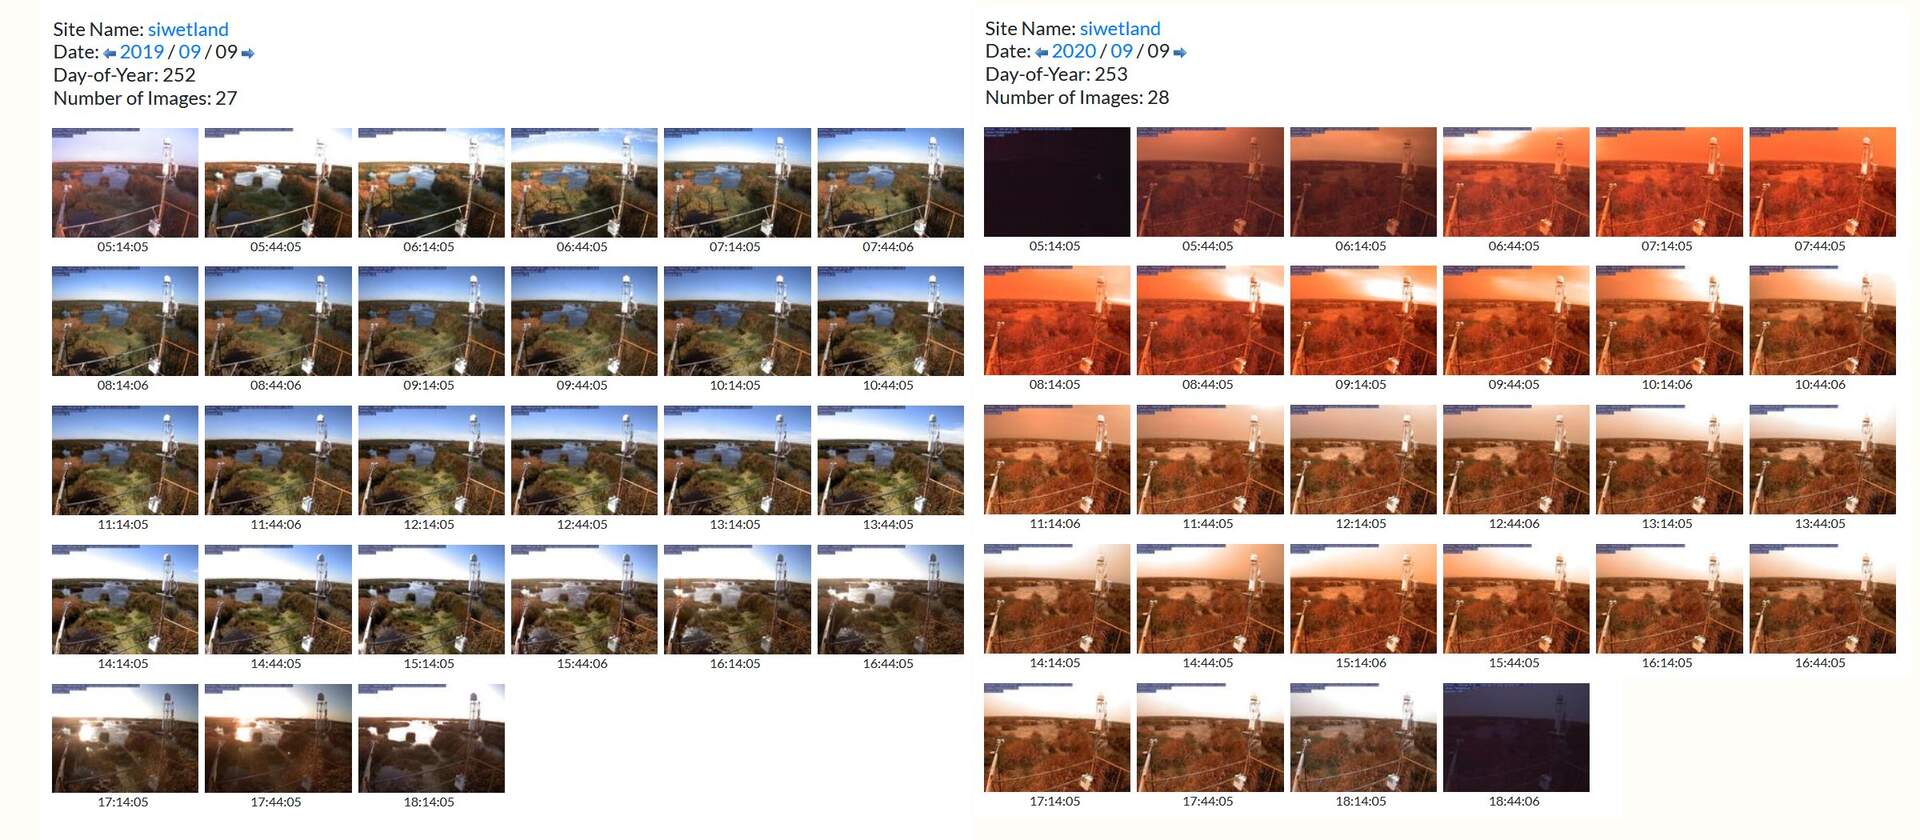
siwetland_09Sept_19vs20.jpg ( 2020-09-09 10:21:10 ) Full size: 1920x840
Contact sheets comparing September 9th photos from 2019 vs 2020

siwetland_2020_09_09_074405.jpg ( 2020-09-09 07:45:36 ) Full size: 1296x960
Orange skies from wildfire smoke
SW_T1_picam_20200909_0815.jpg ( 2020-09-09 08:15:06 ) Full size: 1917x1440
Hazy skies from wildfire smoke
7 sets found
Can't check MBWPEESWGT_mixed
Can't check MBEEWPSWEPGT_cam
16 SW_met graphs found
4 SW_flux graphs found
Can't check MBSWEEWPBCBA
Can't check SW_Temp
14 SW_Temp graphs found
3 SW_arable graphs found