Field Notes
<--2011-04-13 09:45:00 | 2011-04-26 09:00:00-->Other sites visited today: Mayberry | Sherman Island | Tonzi
Phenocam link: Searching...
Twitchell Rice: 2011-04-22 09:30:00 (DOY 112)
Author: Joe Verfaillie
Others: Jaclyn
Summary: Field will be planted today. Tower okay.
| Twitchell
4-22-2011 I arrived about 9:30 with Jaclyn. It was cool and breezy from the west with a high overcast. Kovi from UC Davis was there setting out chambers to make some measurements before the rice was planted later in the day. The field has been prepared for planting and seeds (100lbs per acre?) will go down later in the day. The surface is dry but damp a little way down. Checking on the tower. The soil sensors are still out and the radiation boom is turned to the south. The LGR read: 9:31PDT, 25.93C, 119.74Torr, 16.855usec, 10Hz, 1.856ppm I adjusted the bypass valve to bring the pressure up to 147.10Torr. I adjusted the timing on the plantcam. It is now set to begin taking photos at 5am and to stop at 8pm. I think this is PST, but I need to check it again. Jim and Bruce were there planting field 1 and tractors were working in the fields to the west. |
6 photos found
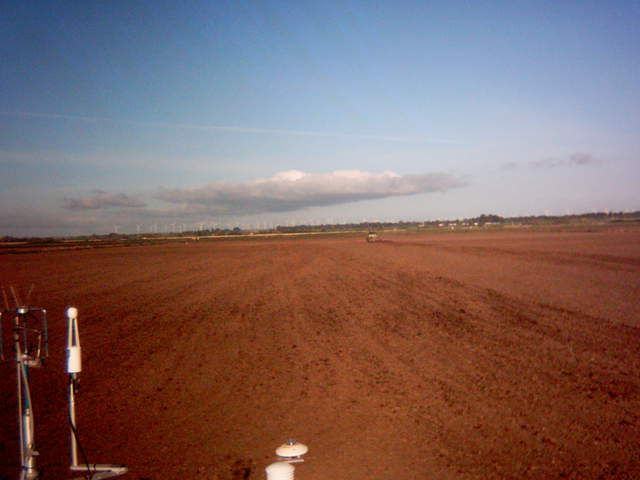
TW_plantcam_20110421_0700.jpg ( 2011-04-21 07:00:00 ) Full size: 2560x1920
Tractor work
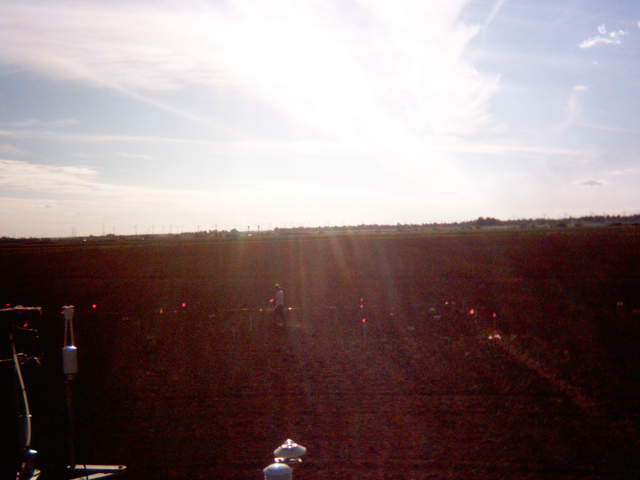
TW_plantcam_20110421_1630.jpg ( 2011-04-21 16:30:00 ) Full size: 2560x1920
UC Davis on site
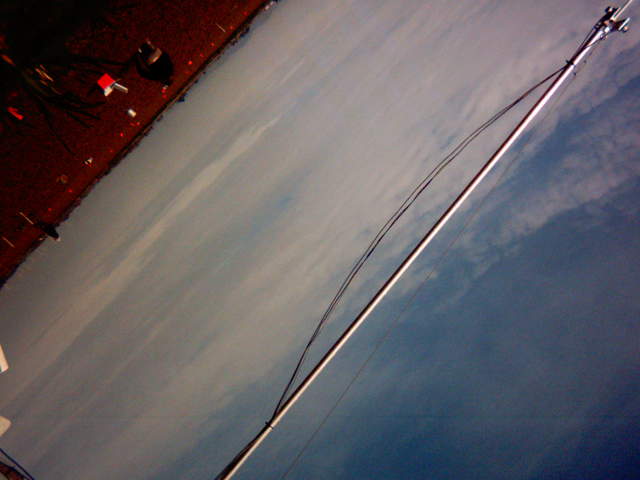
TW_plantcam_20110422_0830.jpg ( 2011-04-22 08:30:00 ) Full size: 2560x1920
Changing camera memory card
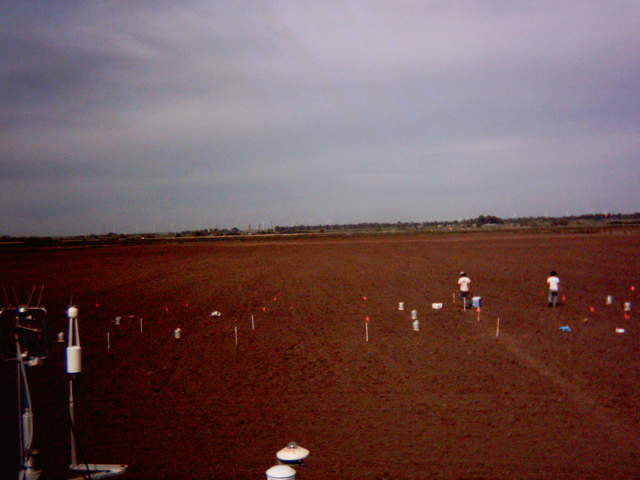
TW_plantcam_20110422_0900.jpg ( 2011-04-22 09:00:00 ) Full size: 2560x1920
UC Davis on site
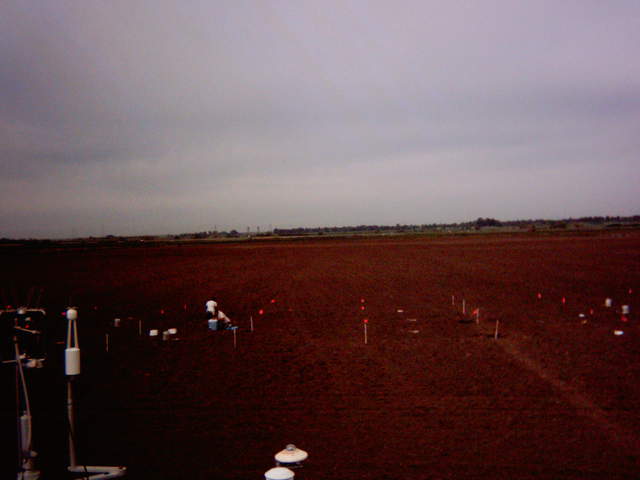
TW_plantcam_20110422_0930.jpg ( 2011-04-22 09:30:00 ) Full size: 2560x1920
UC Davis on site
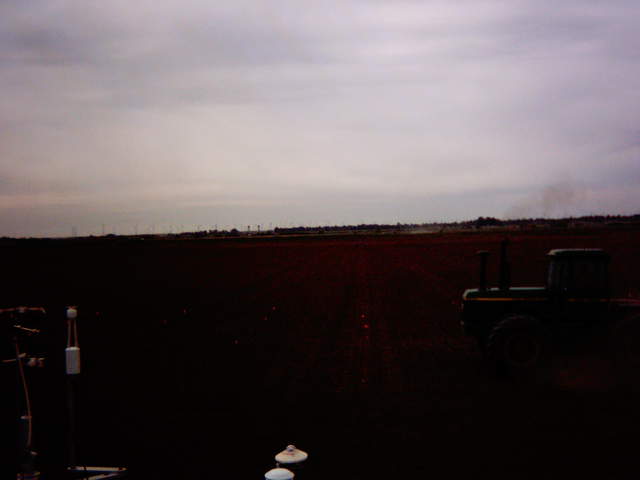
TW_plantcam_20110422_1430.jpg ( 2011-04-22 14:30:00 ) Full size: 2560x1920
Tractor
6 sets found
12 TW_met graphs found
5 TW_flux graphs found
Can't check TWSI_mixed
Can't check SIMBTWEE_met
1 TW_cam graphs found
Can't check TATWBABCSB_cam

