
Field Notes
<--2011-04-15 12:00:00 | 2011-05-03 09:30:00-->Other sites visited today: Mayberry | Sherman Island | Twitchell Rice
Phenocam link: Searching...
Tonzi: 2011-04-22 00:00:00 (DOY 112)
Author: Siyan Ma
Others: Laurier, Naama, Hanna
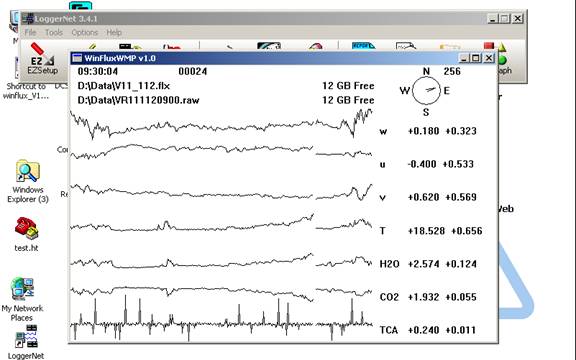
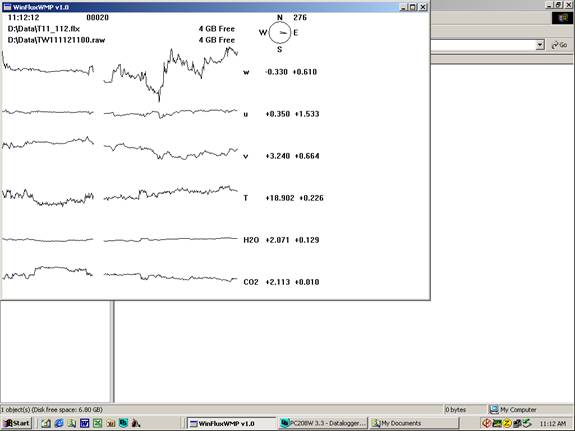
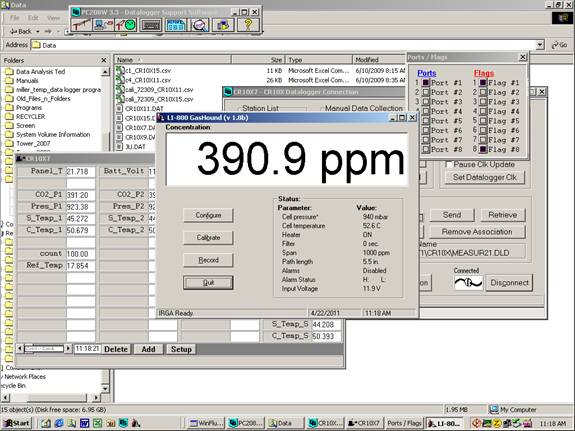
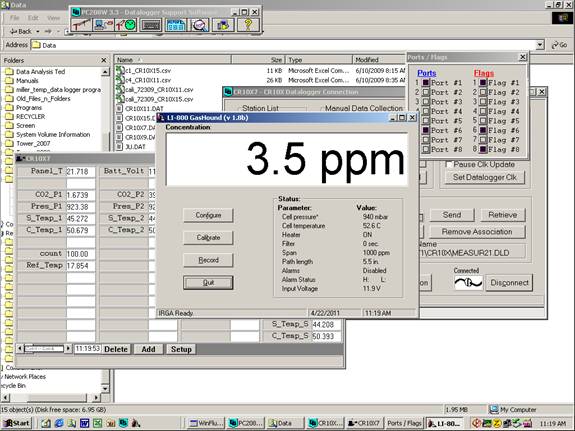
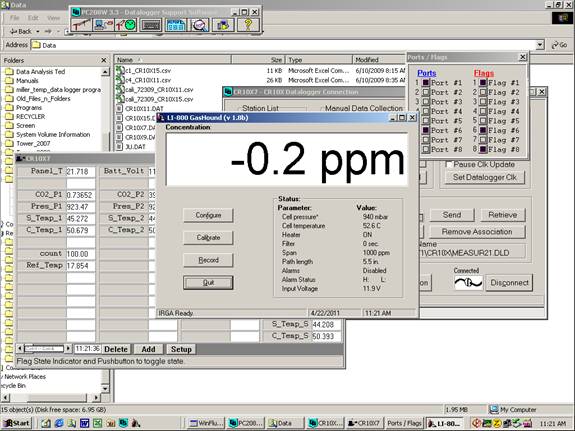
Summary: Tower Li-7500 worked well
|
4/22/2011 Siyan Others: Laurier, Naama, and Hanna Cloudy day, very nice temperature Laurier and Naama visited Mr. Tonzi and asked his permission for root sampling. Vaira I downloaded data, cleaned the surfaces of radiation sensors and rain gauge, and took spectrum measurement. Laurier and Hanna helped to collected grass and litter samples. Naama helped to take soil moisture measurements. Tonzi Tower:
Floor:
Open 2cm, 2930 4cm, 2430 8cm, 2500 16cm, 1910 Under trees 2cm, 2960 4cm, 4500 8cm, 4490 16cm, 1.06% Vaira 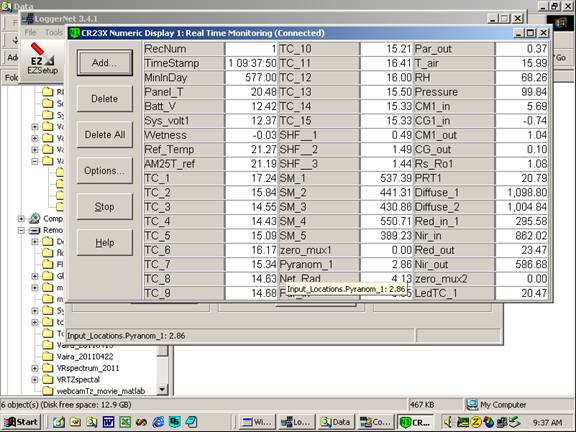
|


Field Data
No tank data
No TZ Well data found
No TZ Moisture Point data found
No VR Moisture Point data found
No TZ grass heigth found
No VR grass heigth found
No TZ Tree DBH found
Water Potential - mode: raw
| Time | Species | Tree | readings (bar) | |||
|---|---|---|---|---|---|---|
| 2011-04-22 12:03:00 | OAK | UNKNOWN | -8 | -13.5 | -9 | |
| 2011-04-22 12:03:00 | PINE | UNKNOWN | -14.5 | -14 | -3 | -2 |
No TZ Grass Biomass data found
No TZ OakLeaves Biomass data found
No TZ PineNeedles Biomass data found
13 photos found
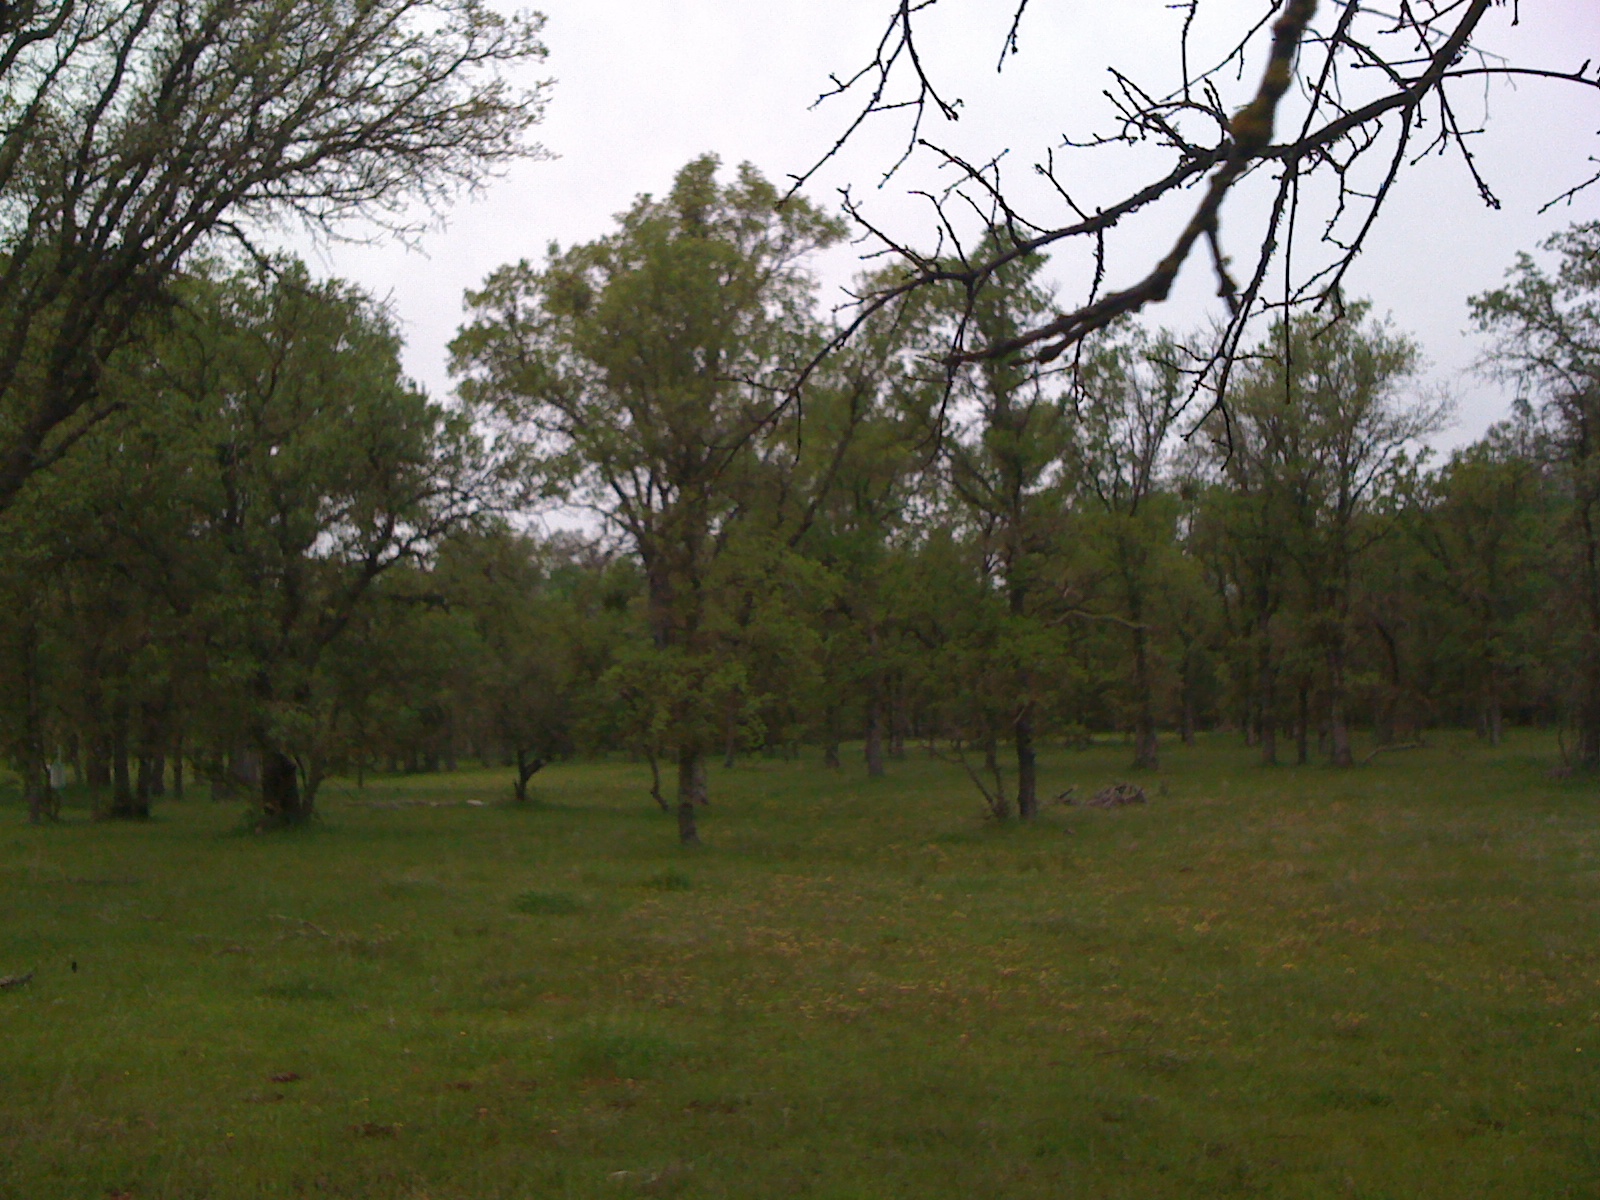
tz__7708.jpg ( 2011-04-22 12:10:21 ) Full size: 1600x1200
Green oak savanna
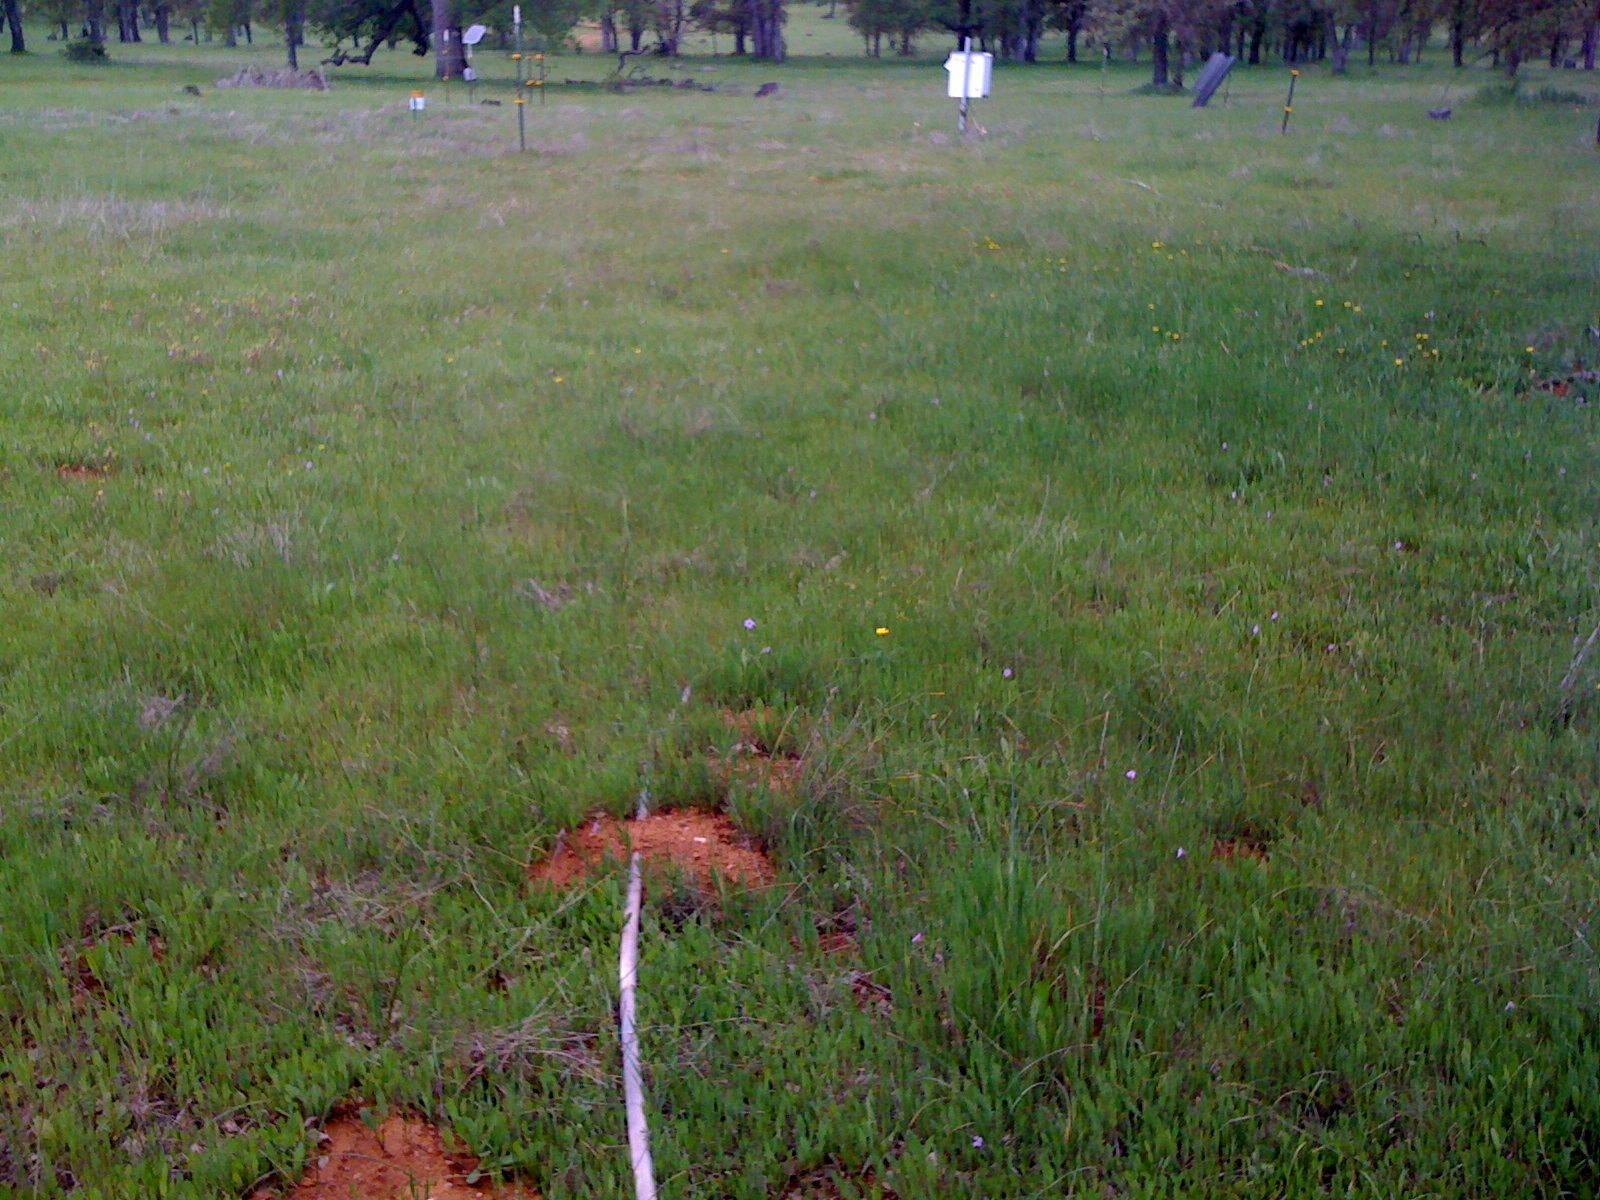
tz__7709.jpg ( 2011-04-22 12:10:39 ) Full size: 1600x1200
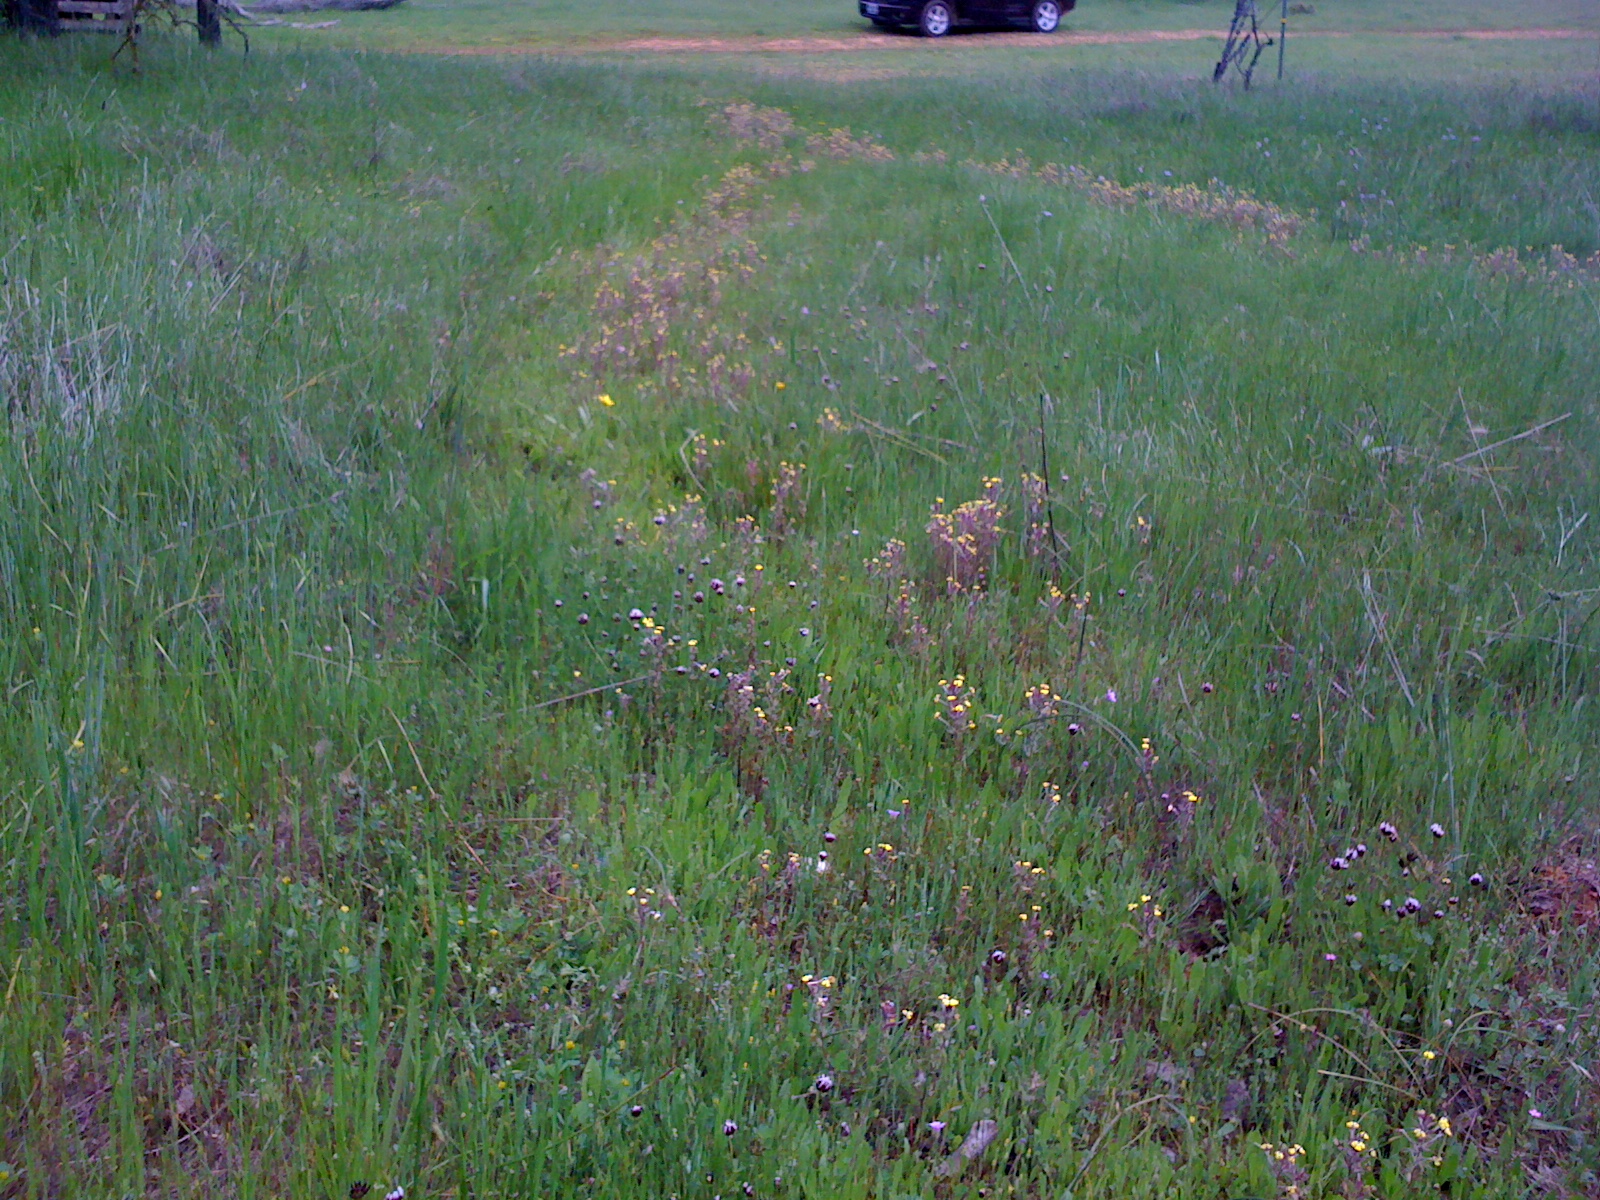
Green grass at Tonzi
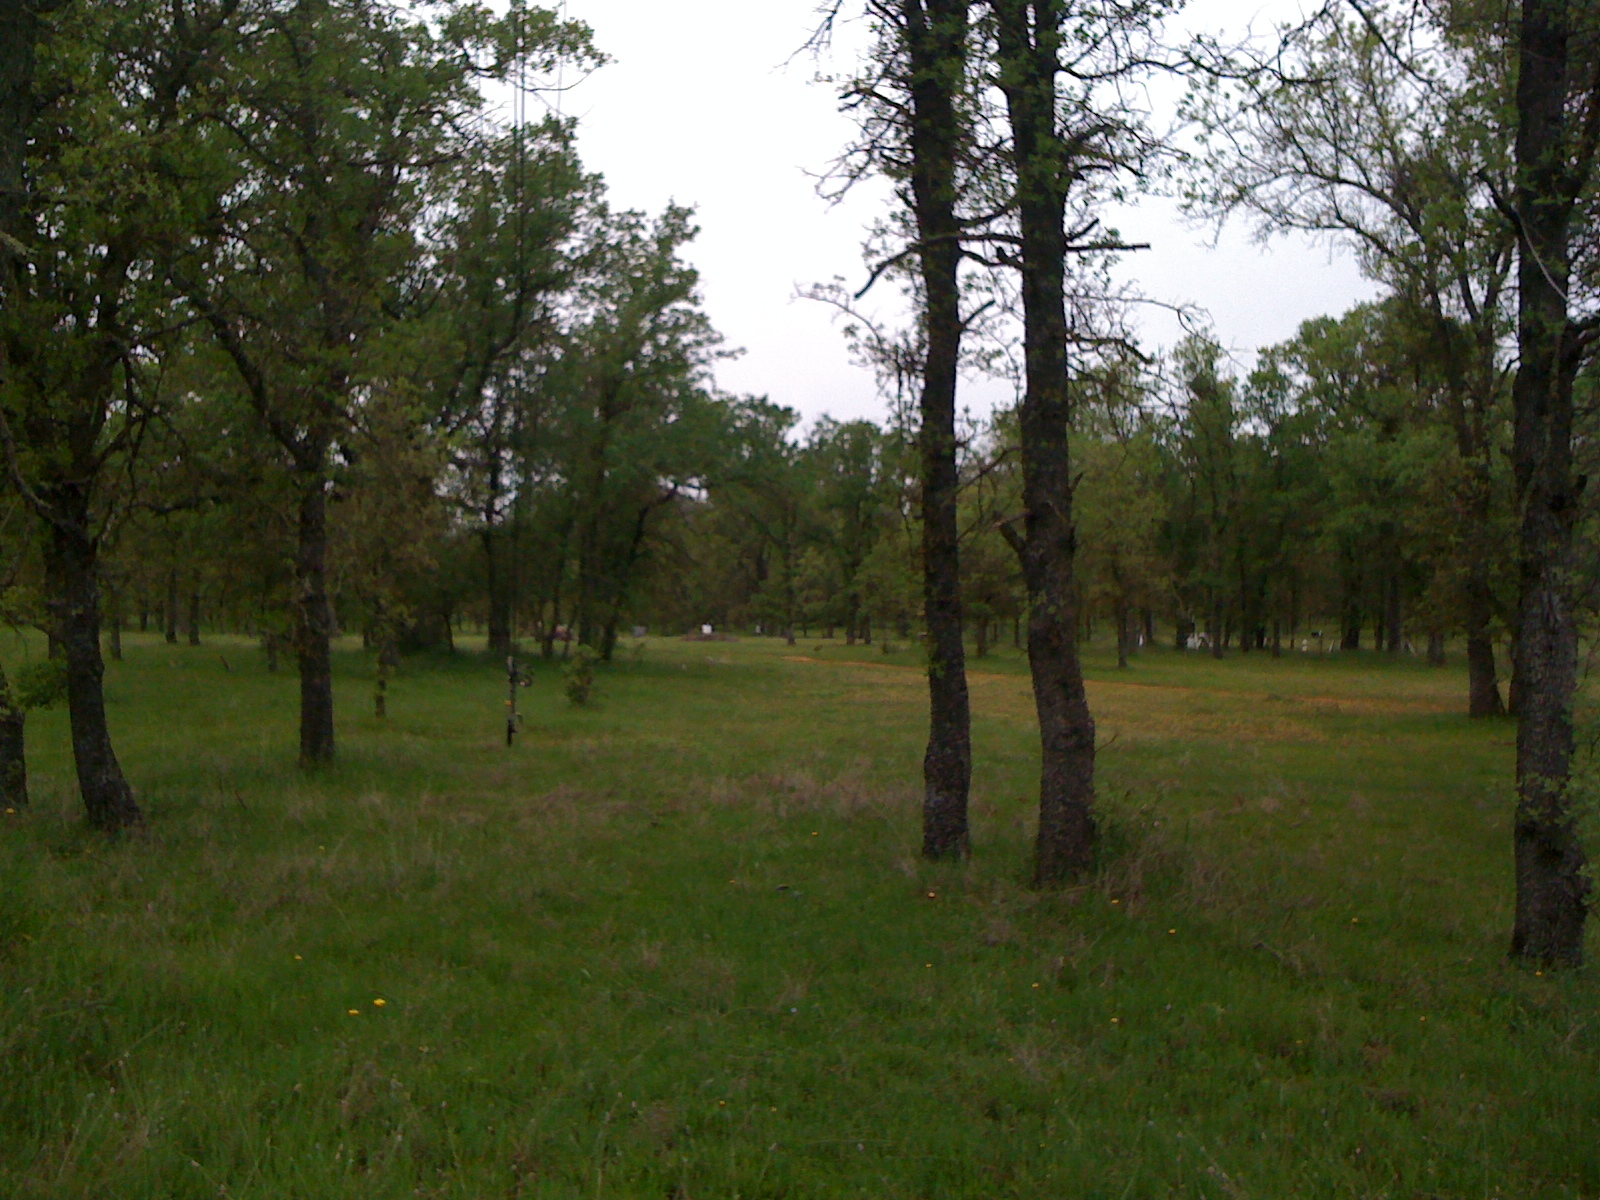
tz__7710.jpg ( 2011-04-22 12:15:30 ) Full size: 1600x1200
Green grass and trees at Tonzi
tz__7711.jpg ( 2011-04-22 12:15:44 ) Full size: 1600x1200
Green grass and flowers
tz__7712.jpg ( 2011-04-22 12:15:54 ) Full size: 1600x1200
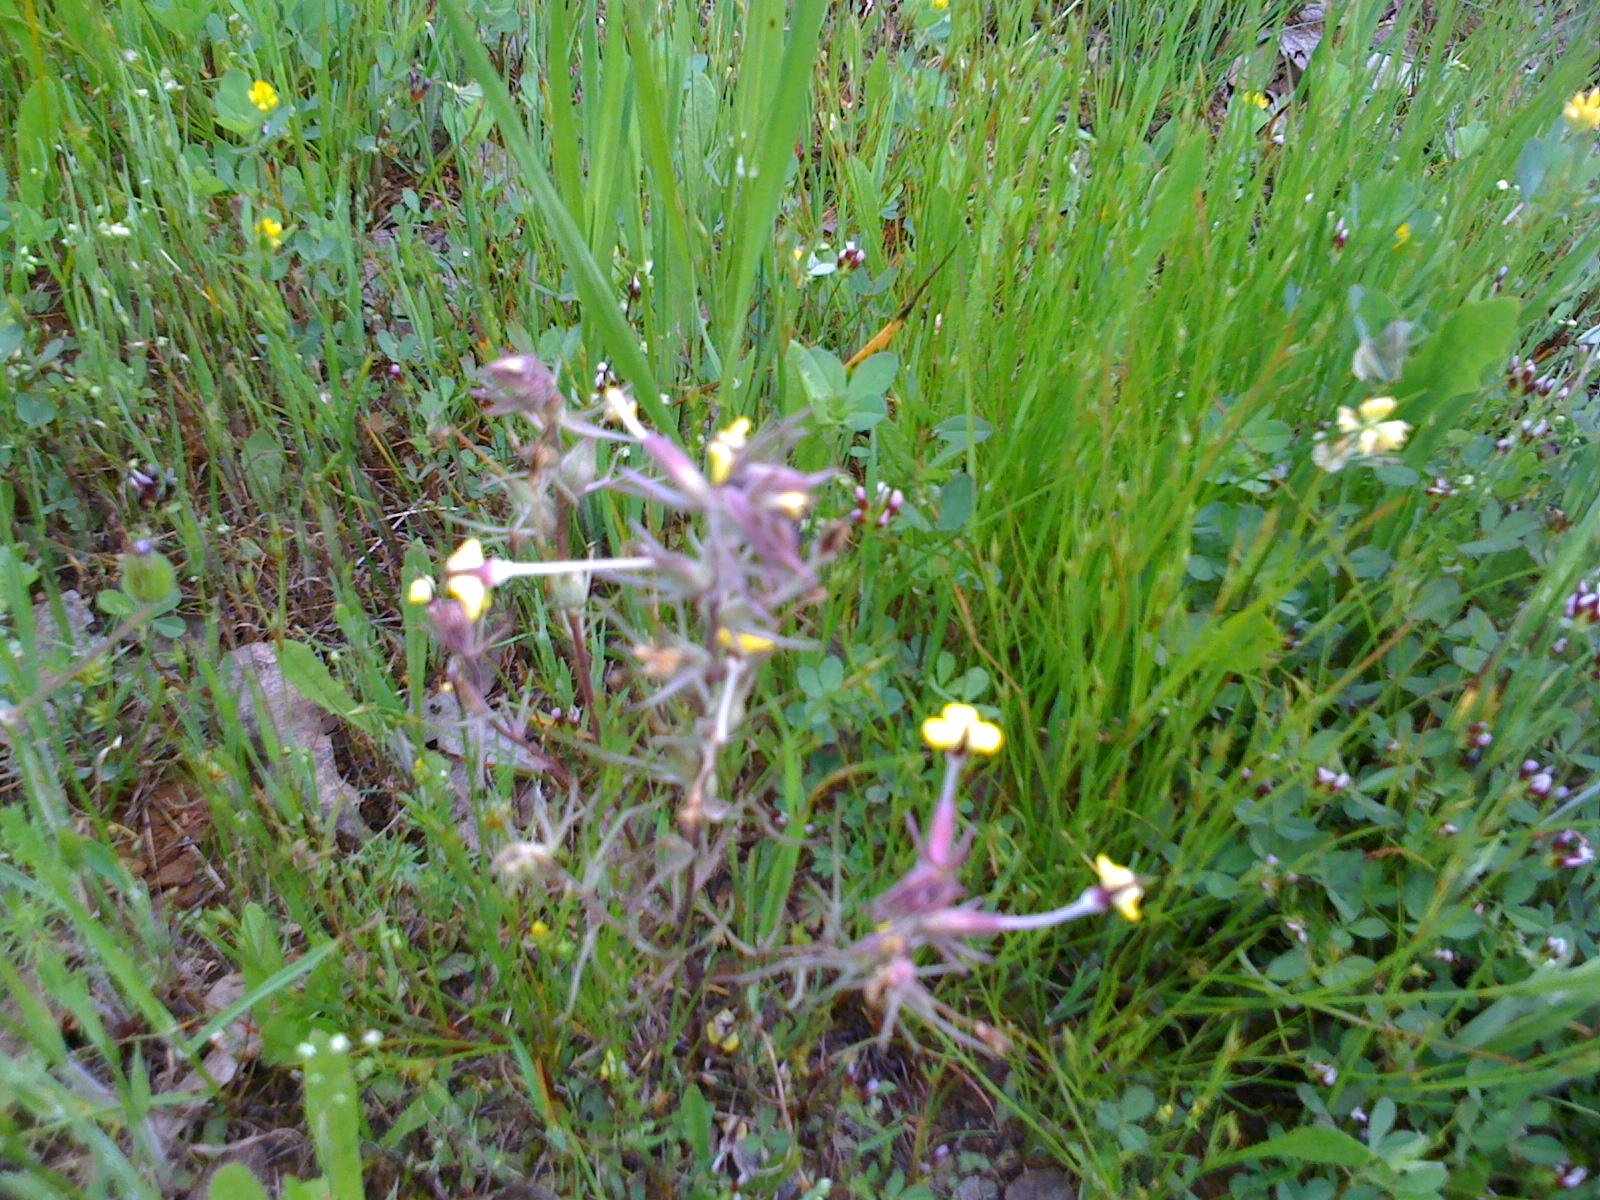
Yellow flowers in green grass
tz__7713.jpg ( 2011-04-22 12:16:16 ) Full size: 1600x1200
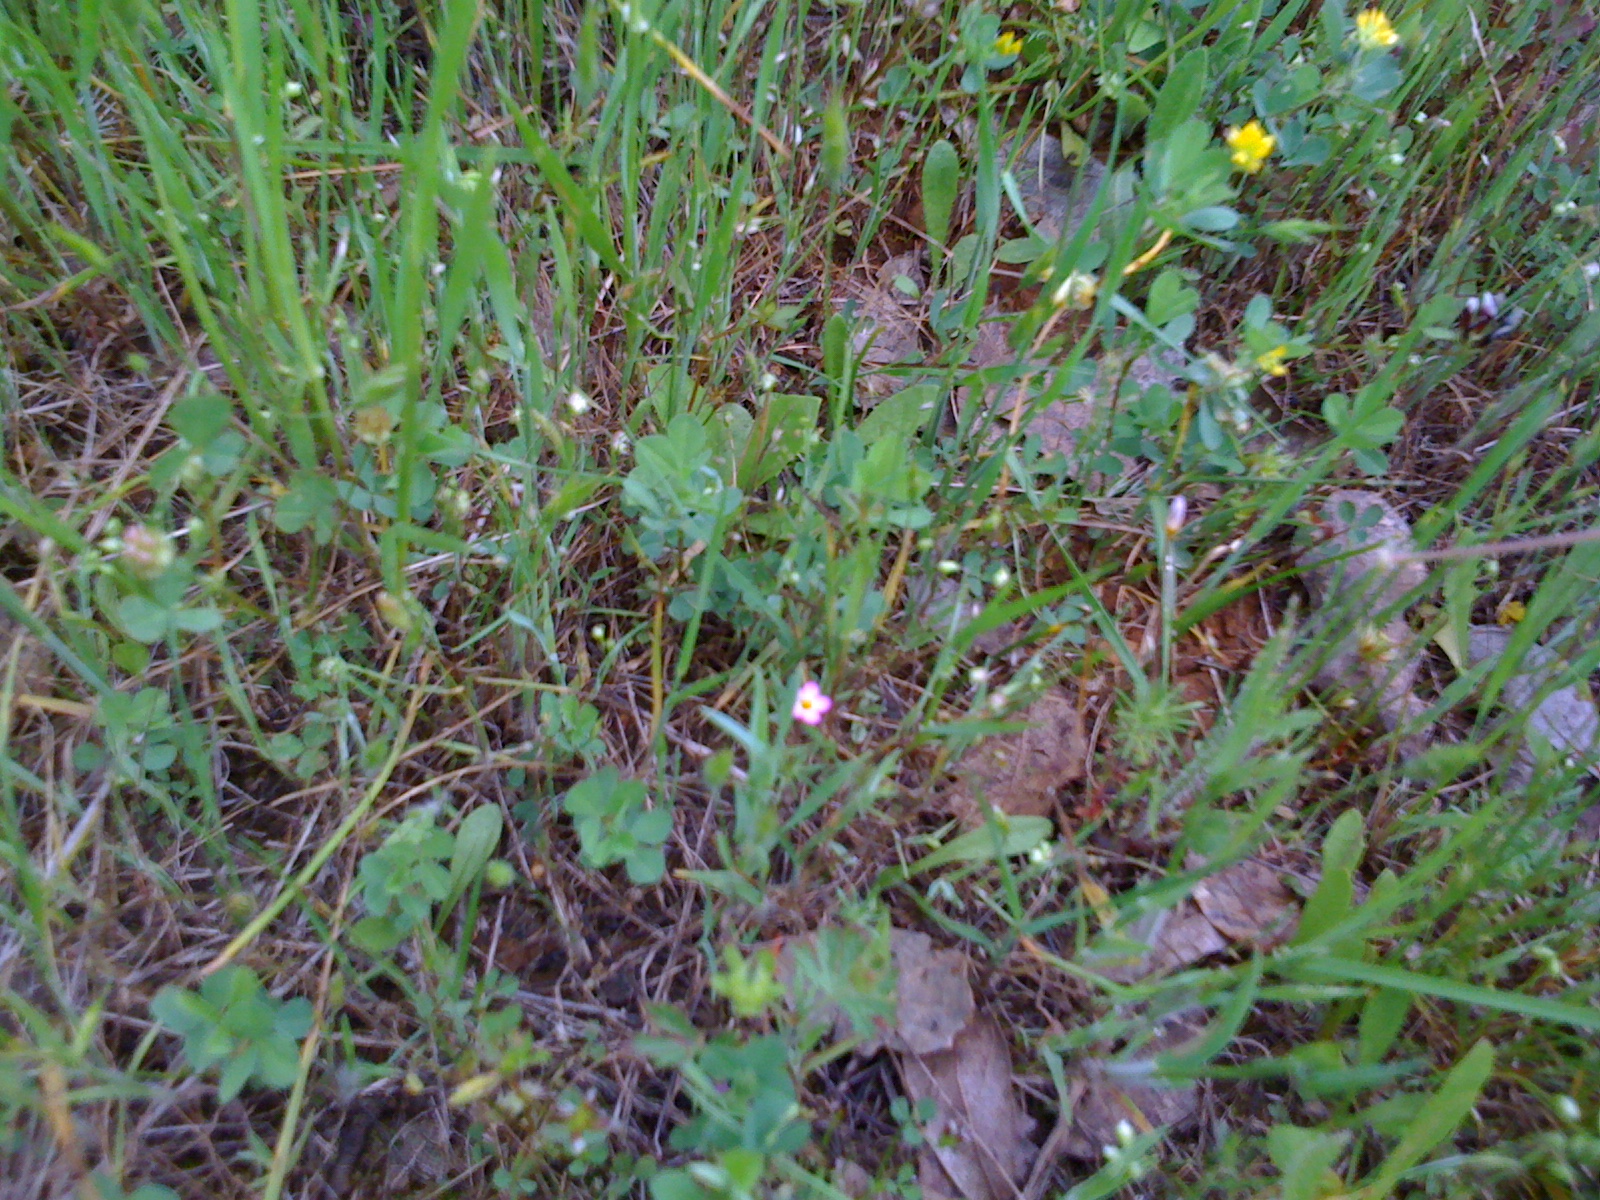
Yellow and pink flowers in green grass
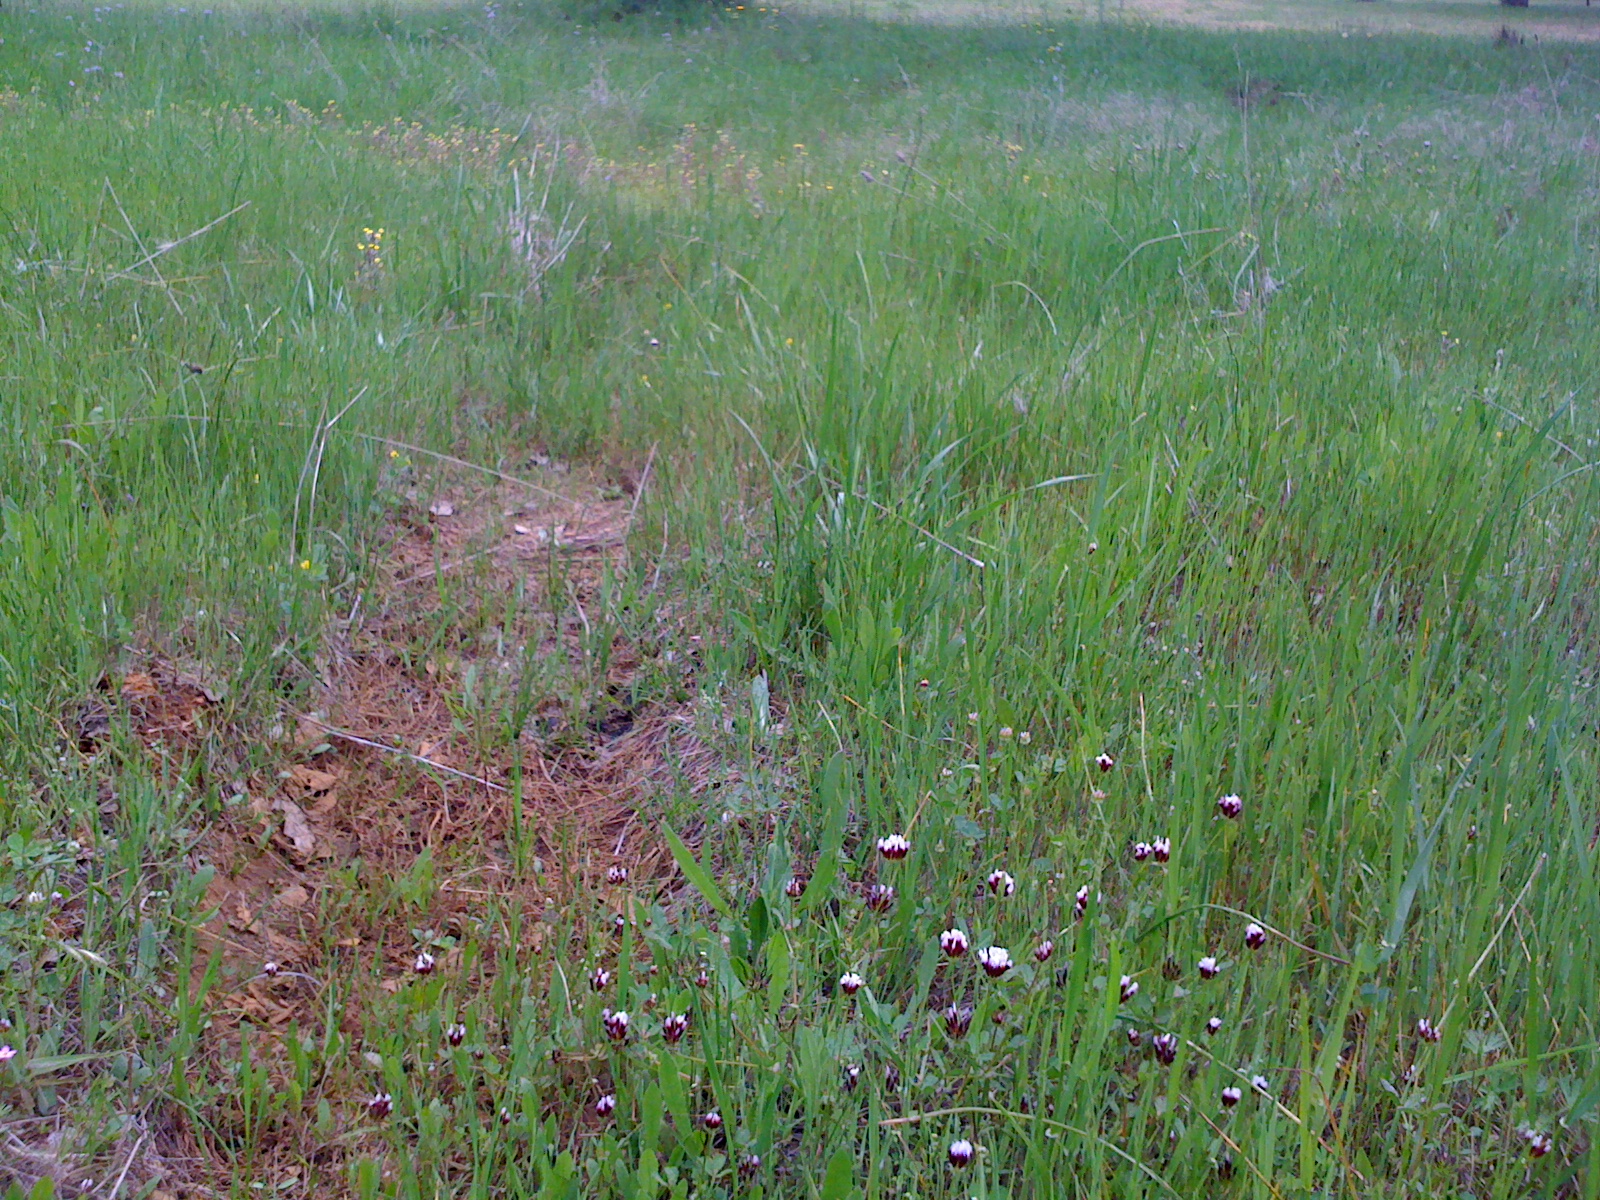
tz__7714.jpg ( 2011-04-22 12:16:32 ) Full size: 1600x1200
Close up of grass and flowers
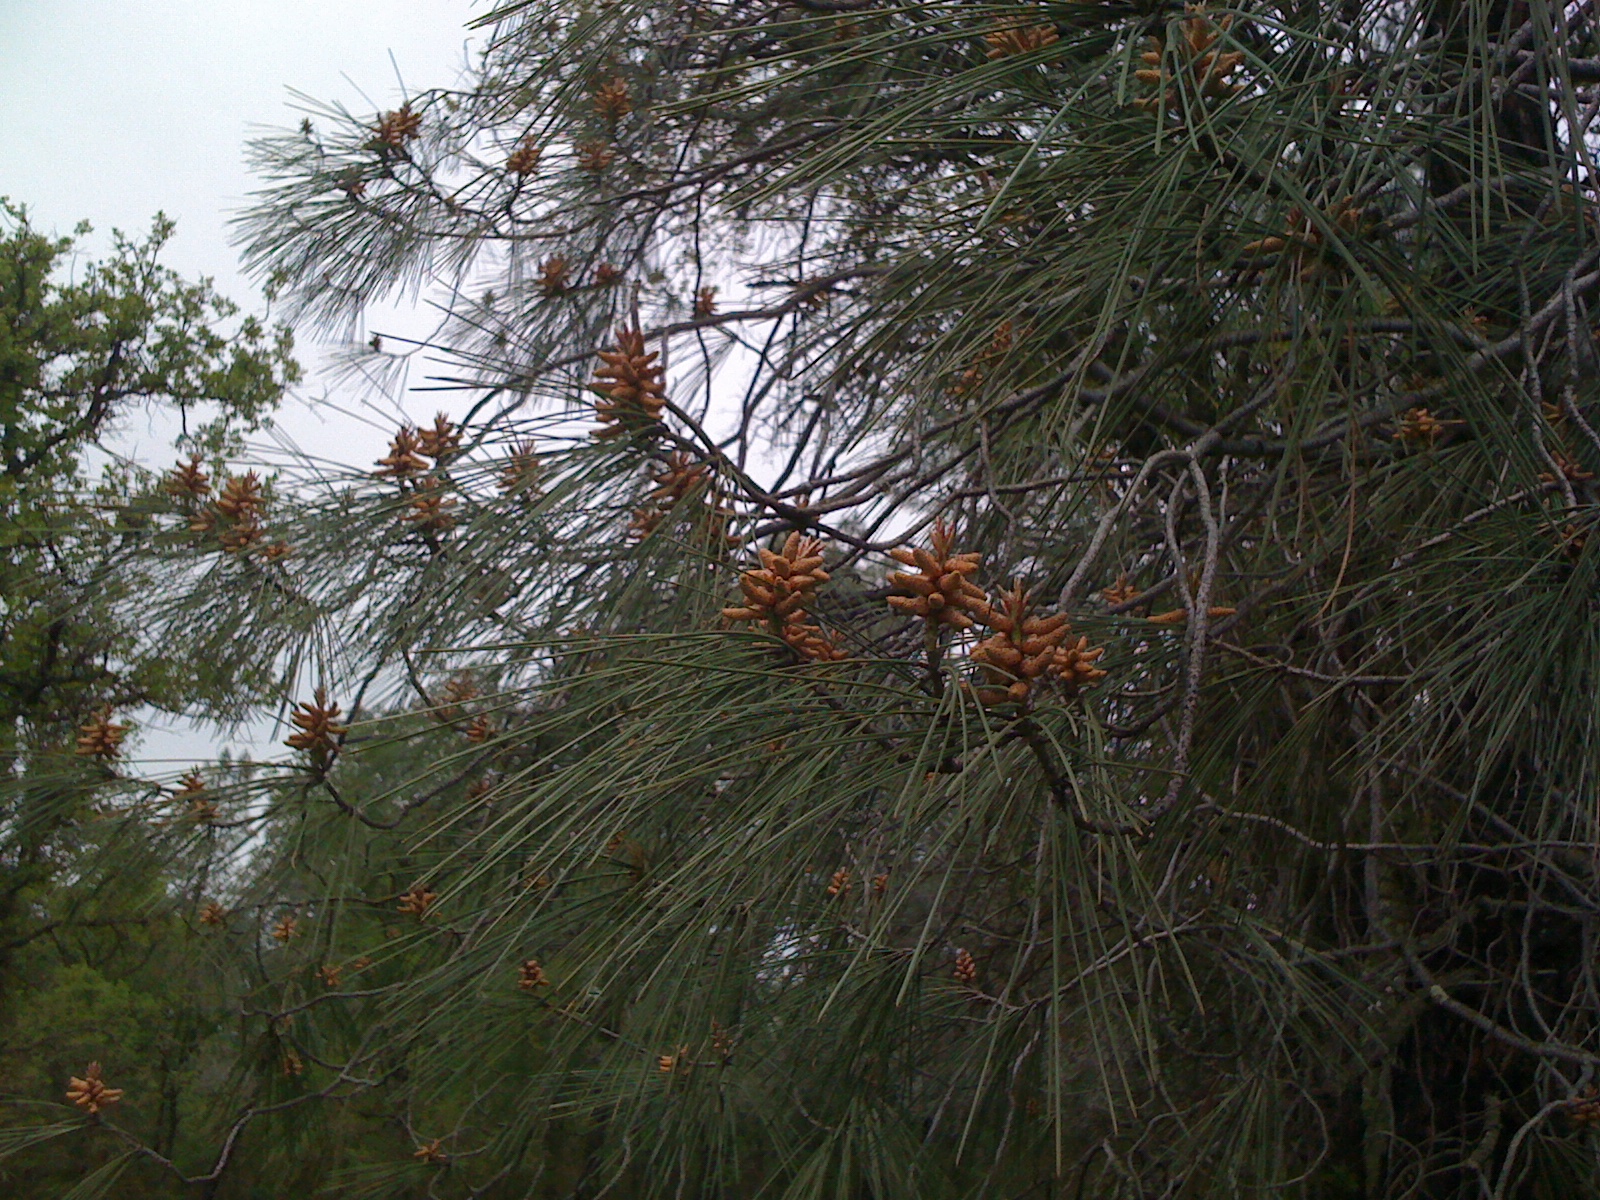
tz__7715.jpg ( 2011-04-22 13:03:03 ) Full size: 1600x1200
Male flowers on pine branches
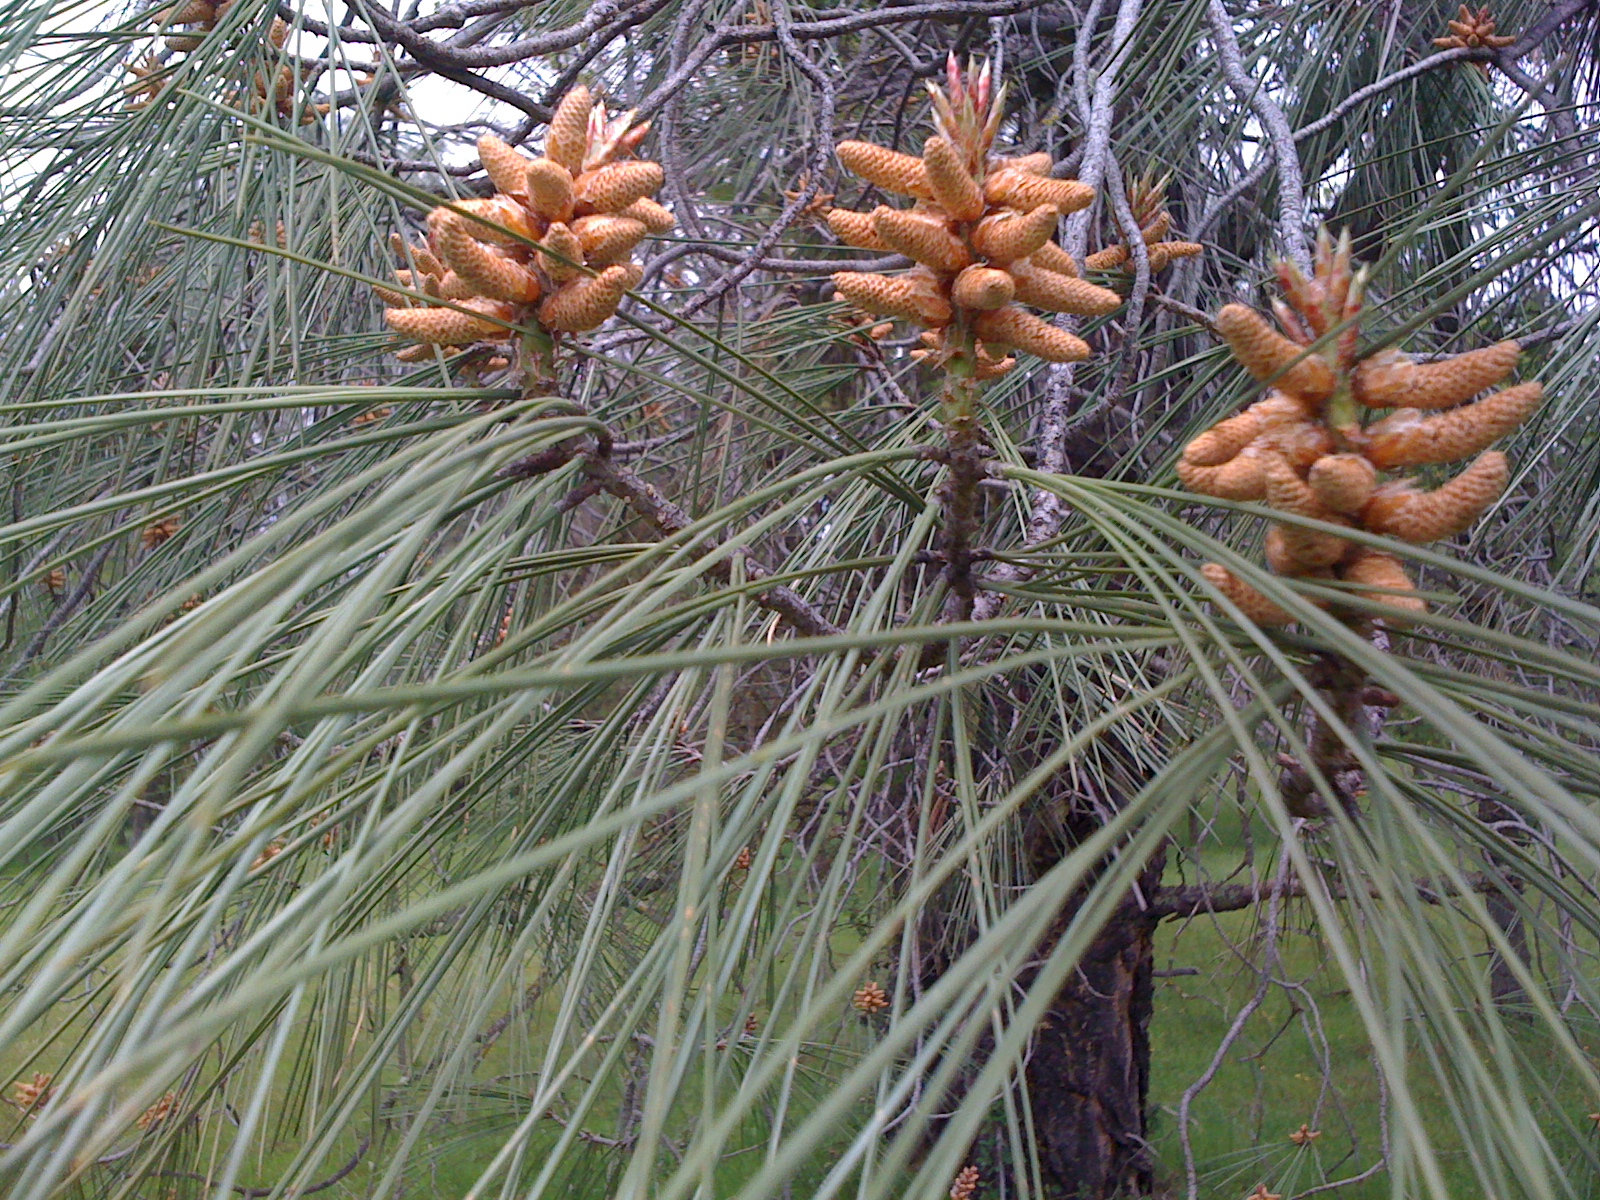
tz__7716.jpg ( 2011-04-22 13:03:09 ) Full size: 1600x1200
Close up of male flowers on pine branches
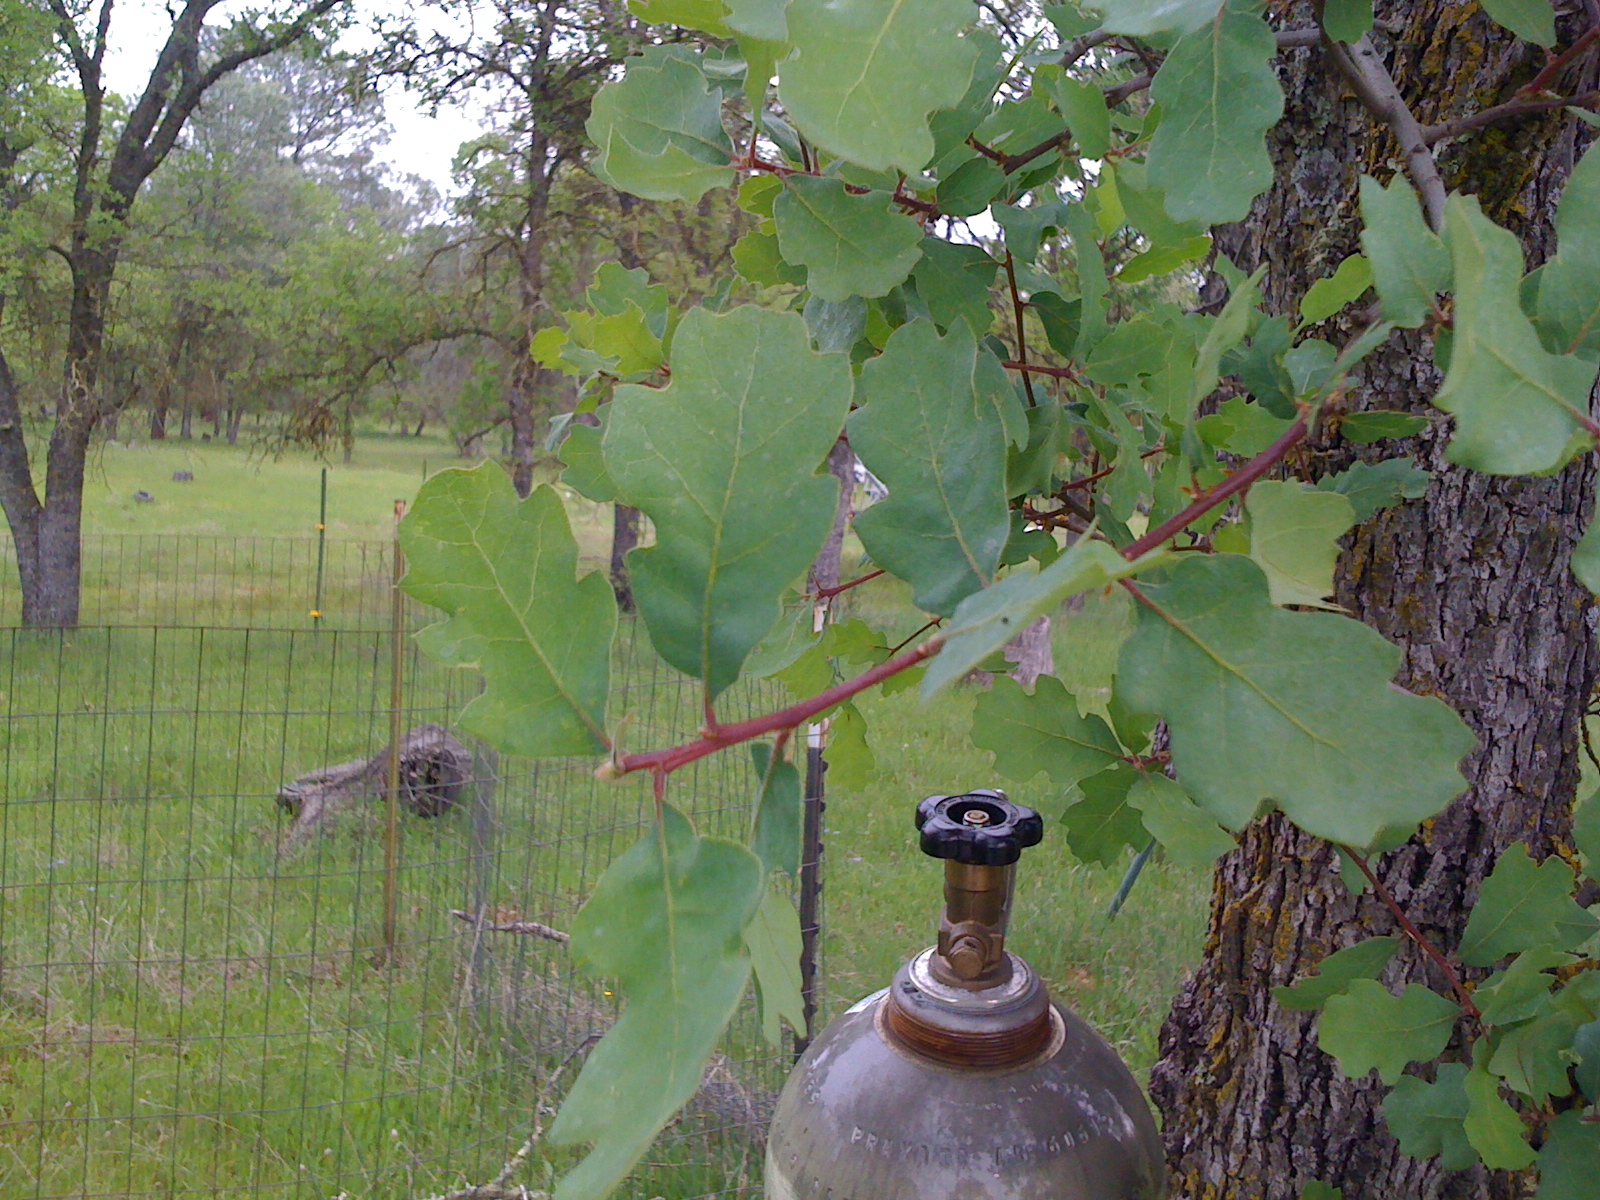
tz__7717.jpg ( 2011-04-22 13:12:48 ) Full size: 1600x1200
Fresh oak leaves on twig and top of pressure tank
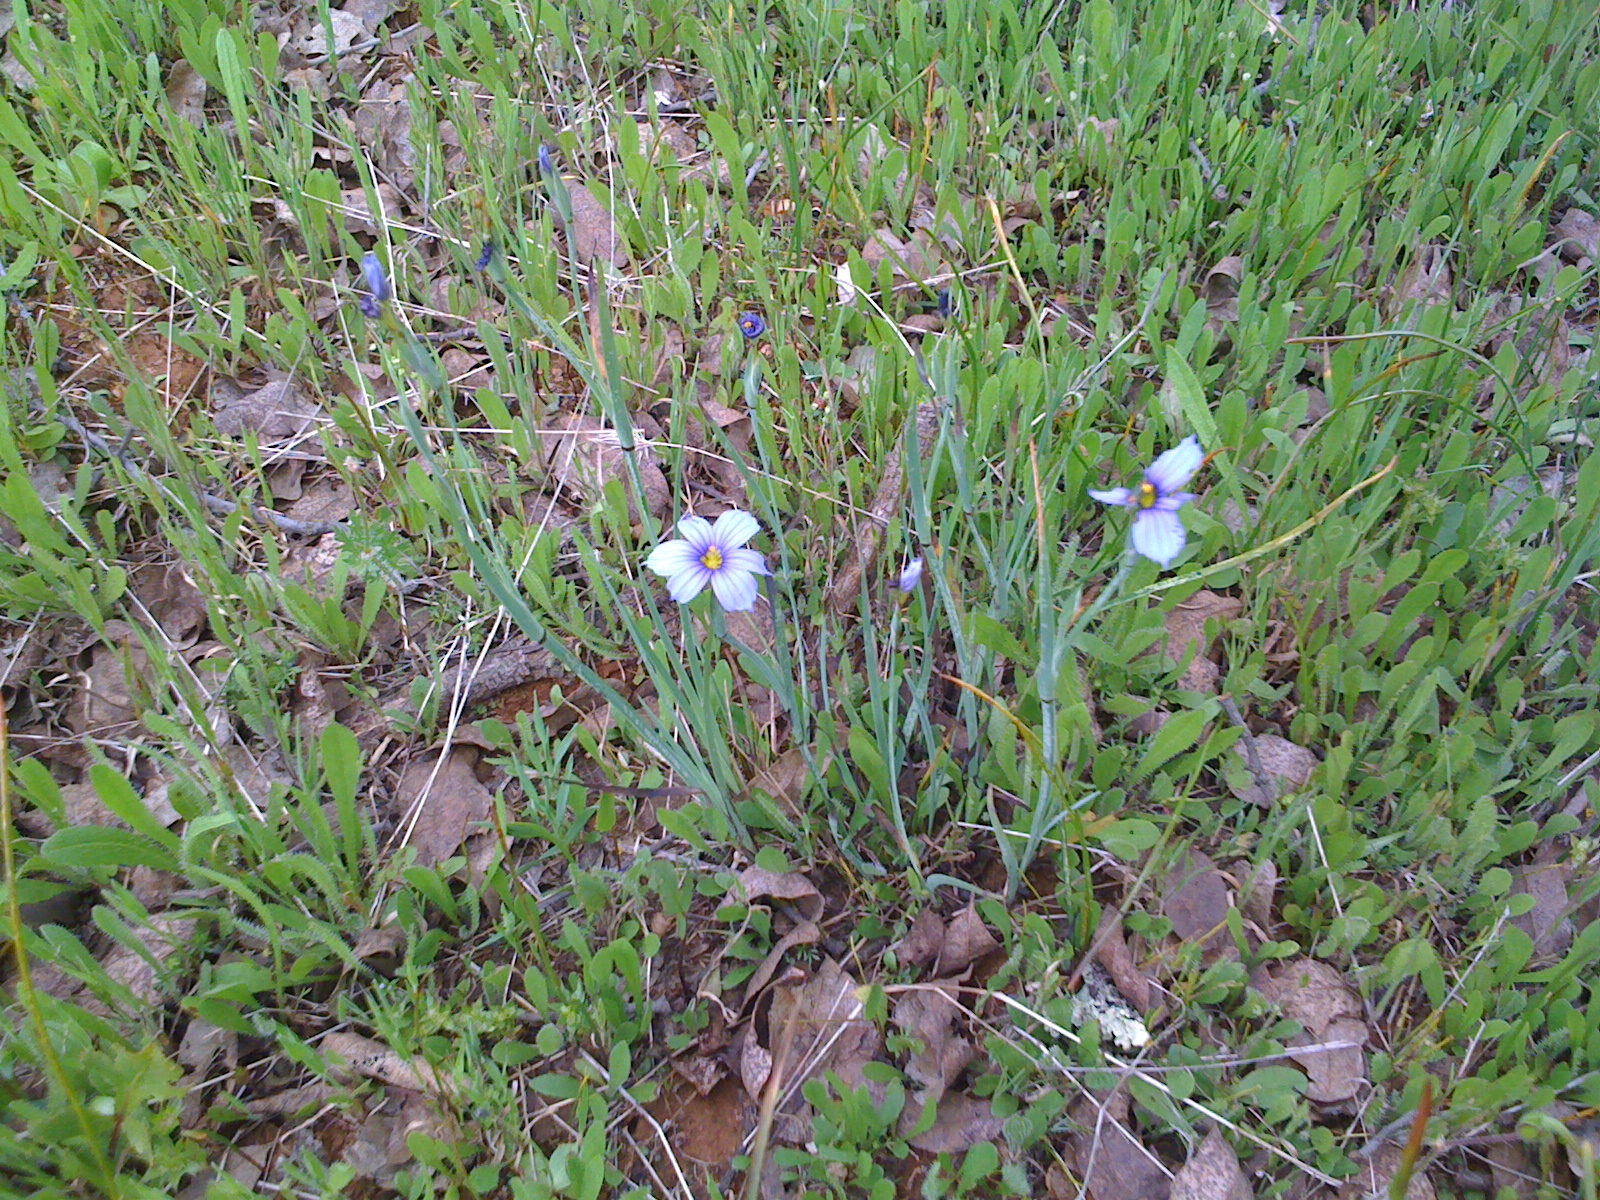
tz__7718.jpg ( 2011-04-22 13:12:56 ) Full size: 1600x1200
Iris and young grass
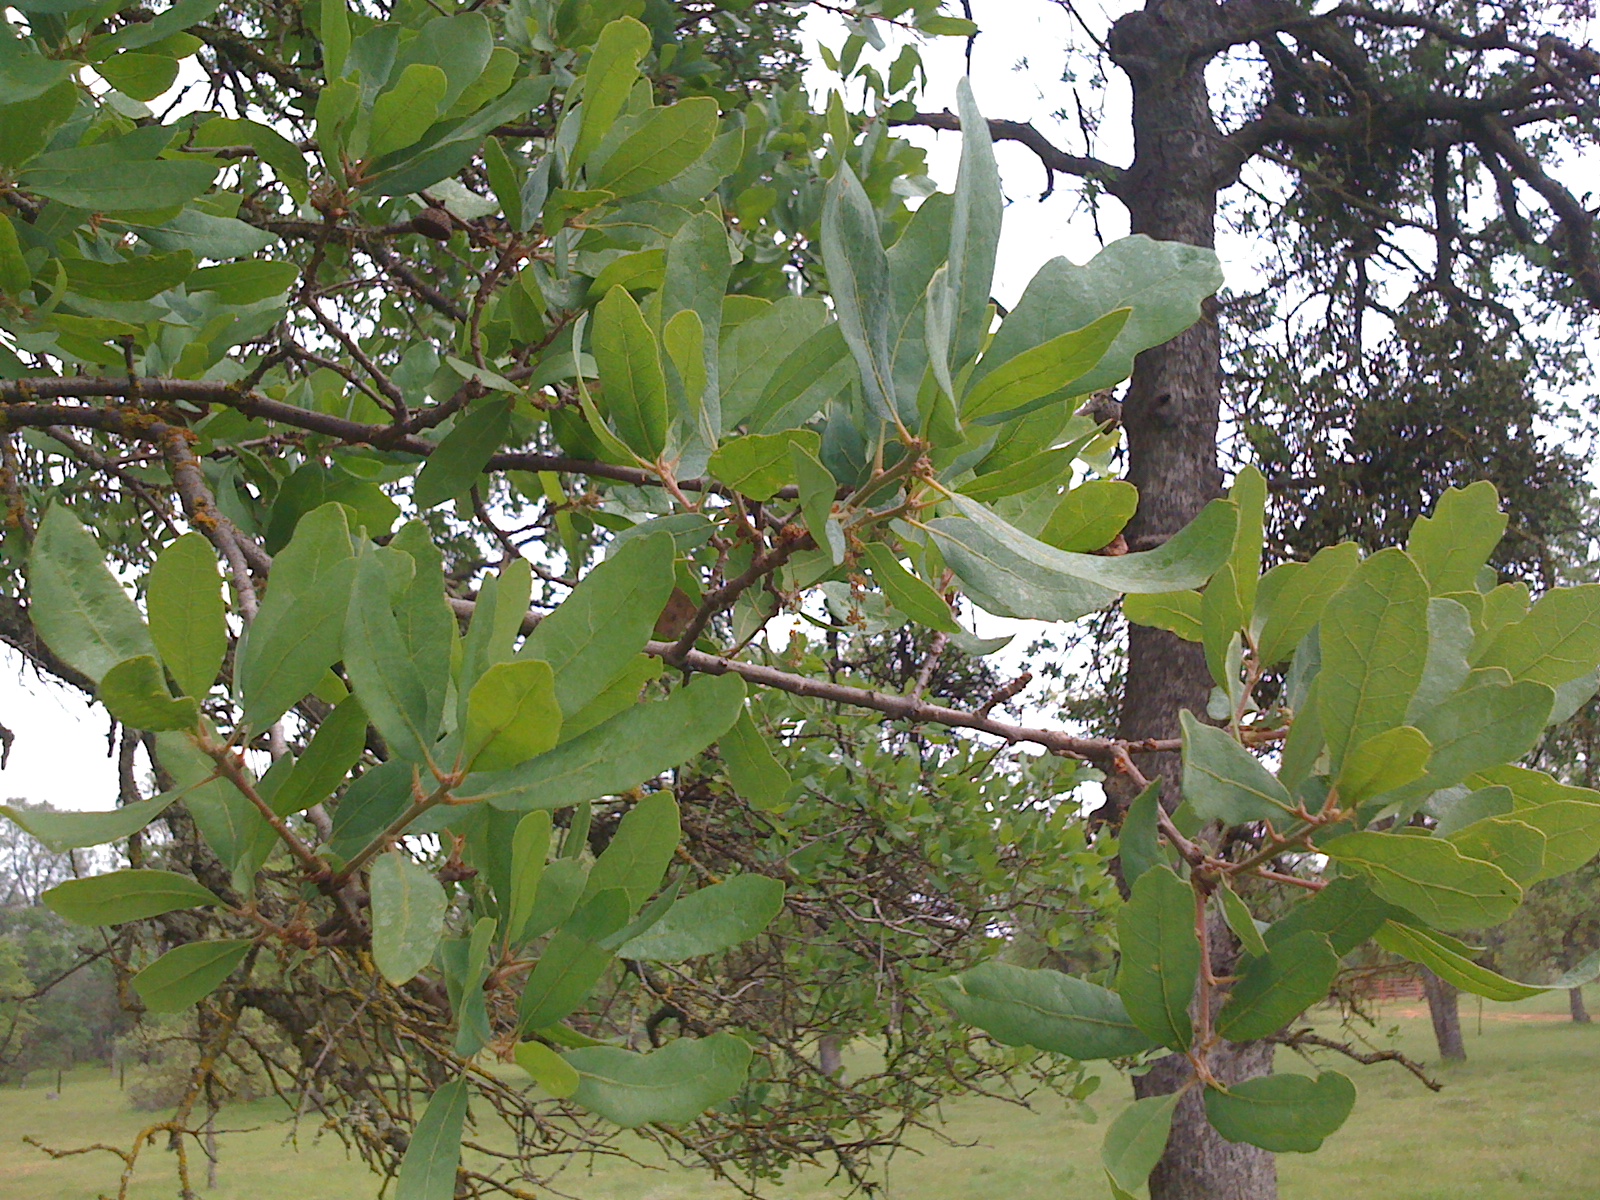
tz__7722.jpg ( 2011-04-22 14:24:27 ) Full size: 1600x1200
Fresh oak leaves on twigs
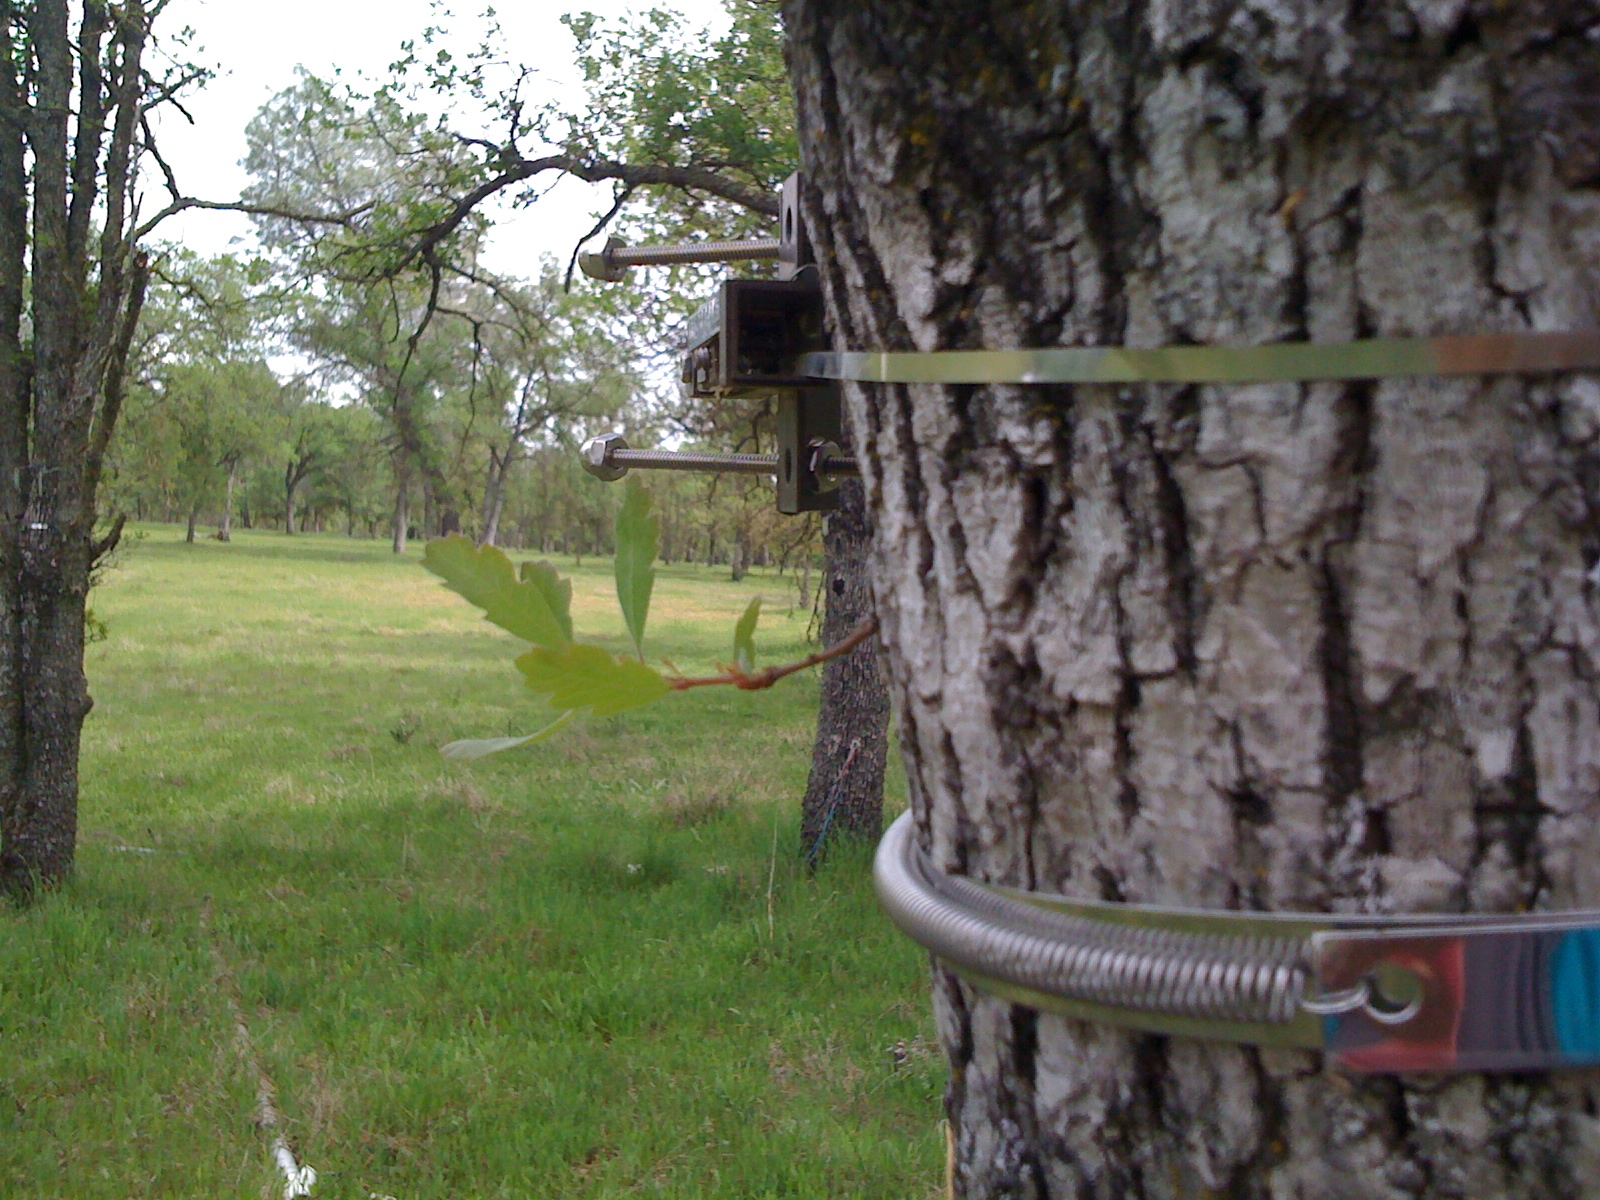
tz__7724.jpg ( 2011-04-22 14:36:37 ) Full size: 1600x1200
Two dendrometer bands on oak trunk
16 sets found
No data found for TZ_Fenergy.
11 TZ_tmet graphs found
11 TZ_soilco2 graphs found
Can't check TZ_mixed
3 TZ_mixed graphs found
1 TZ_fflux graphs found
8 TZ_fmet graphs found
1 TZ_tram graphs found
3 TZ_co2prof graphs found
No data found for TZ_irt.
No data found for TZ_windprof.
No data found for TZ_tflux.
2 TZ_sm graphs found
Can't check TZ_met
1 TZ_met graphs found
Can't check TZVR_mixed
No data found for TZ_osu.
No data found for TZ_fd.
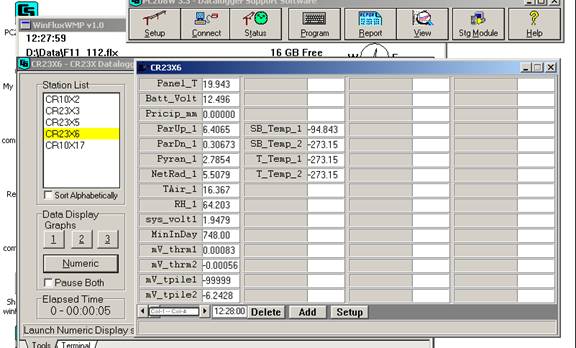
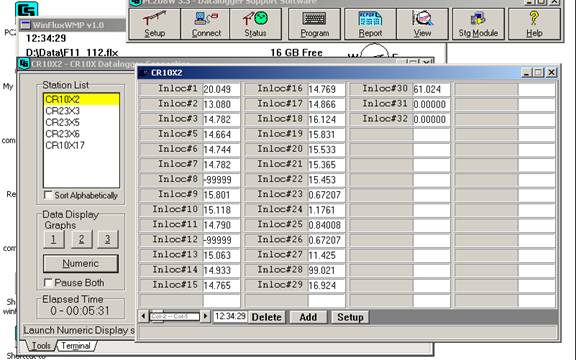
Tonzi Z-cam data