Field Notes

<--2024-10-10 12:15:00 | 2024-10-24 11:25:00-->
Other sites visited today: Bouldin Alfalfa | East End | Gilbert Tract
Phenocam link: Searching...

Hill Slough: 2024-10-17 08:30:00 (DOY 291)
Author: Daphne Szutu
Others: Joe

Summary: Quick stop to remove EXO for calibration

2024-10-17
Hill Slough

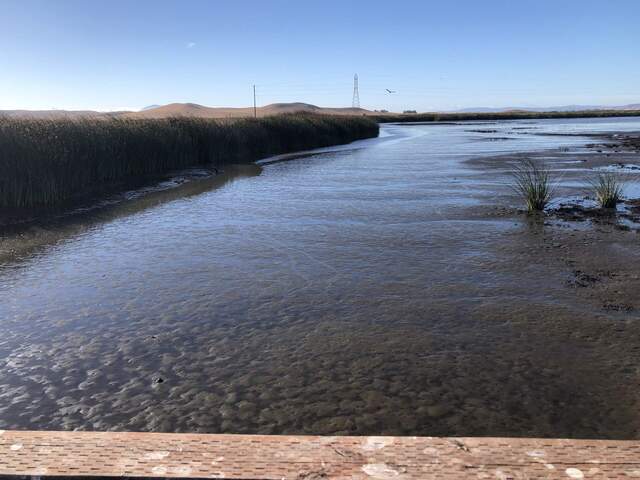
Joe and I arrived around 8:30 PST. It was mild and partly sunny. This was just a quick stop to grab the EXO from the channel because it is due for calibration. It was low tide and the sensor end of the EXO was half-buried in the mud. The channel has completely filled it. There is hardly any depression remaining in the surface. The staff gauge read 3.71ft at 8:40 PST, but might not be accurate because it was surrounded by mud.

Sensors removed:
sn 22C103416 EXO2
sn 22E106072 Turbidity
sn 24F104438 fDOM
sn 23D104030 Conductivity/Temperature
sn 24A100660 wiper

2 photos found

Channel east of the tower has completely filled in since reflooding in October 2021.
20241017HS_ChannelFilled.jpg ( 2024-10-17 09:38:09 ) Full size: 1920x1440
Channel east of the tower has completely filled in since reflooding in October 2021.
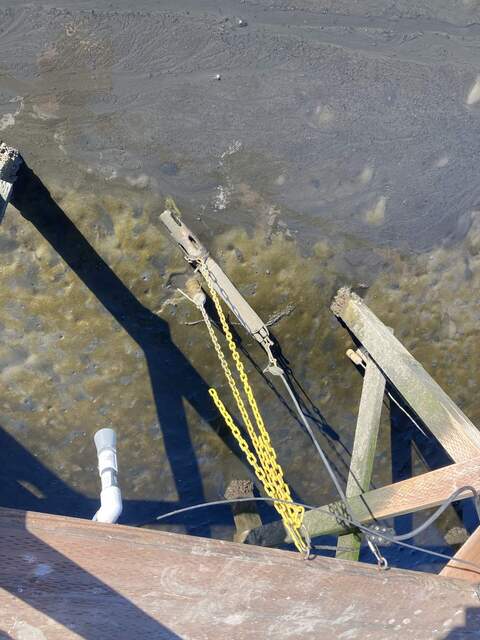
Water sensors half buried in the mud at low tide
20241017HS_WaterSensorInMud.jpg ( 2024-10-17 09:38:07 ) Full size: 1440x1920
Water sensors half buried in the mud at low tide

Graphs display:
4 sets found

20 HS_met graphs found

Explore the graph:Temperatures in a new window

Explore the graph:Temperature Profile A in a new window

Explore the graph:Temperature Profile B in a new window

Explore the graph:Temperature Profile C in a new window

Explore the graph:Soil Heat Flux in a new window

Explore the graph:Four-channel radiometer in a new window

Explore the graph:NDVI Channels in a new window

Explore the graph:PAR in a new window

Explore the graph:Air Pressure in a new window

Explore the graph:Air T and RH in a new window

Explore the graph:pCO2 in a new window

Explore the graph:Soil Moisture in a new window

Explore the graph:Battery Voltage in a new window

Explore the graph:Forced Diffusion Soil CO2 Flux in a new window

Explore the graph:Dissolved Oxygen in a new window

Explore the graph:Water Level in a new window

Explore the graph:Conductivity in a new window

Explore the graph:EXO pH + ORP in a new window

Explore the graph:EXO Turbidity + fDOM in a new window

Explore the graph:Water Temp in a new window

4 HS_flux graphs found

Explore the graph:CO2 and H2O in a new window

Explore the graph:Wind in a new window

Explore the graph:Methane in a new window

Explore the graph:Data Counts in a new window

1 HS_cam graphs found

Explore the graph:GCC in a new window

Can't check HS_Processed
2 HS_Processed graphs found

Explore the graph:Energy in a new window

Explore the graph:CO2, CH4 Net Fluxes in a new window