Field Notes

<--2024-10-09 10:15:00 | 2024-10-23 13:35:00-->
Other sites visited today: Hill Slough | East End | Gilbert Tract
Phenocam link: Searching...

Bouldin Alfalfa: 2024-10-17 09:40:00 (DOY 291)
Author: Daphne Szutu
Others: Joe

Summary: Field is planted, quick stop to grab boardwalk and posts

2024-10-17
Bouldin Alfalfa

Joe and I arrived around 9:40 PST. It was mild and partly sunny. This was a quick stop to grab an extra boardwalk (for installing permanently at Rush Ranch) and the 8’ posts (for raising the solar panel scaffolding at East End).
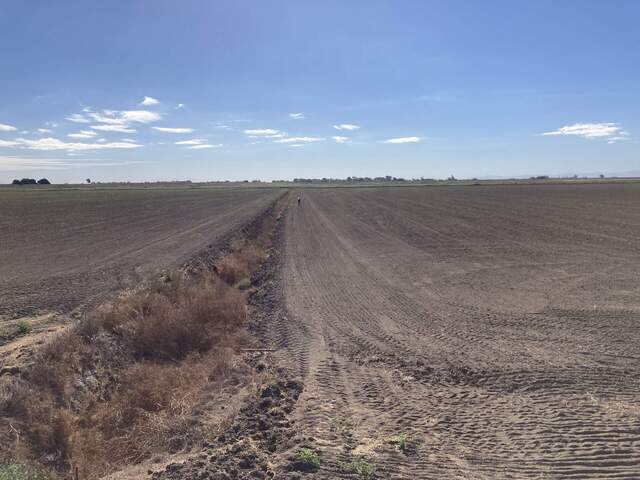
It looks like they’ve finished planting our field—Joe dug up a pile of wheat seeds. There are some green alfalfa plants coming up in both alfalfa fields. They may spray the field to keep the alfalfa down. We parked off of the field and walked in.

I downloaded the usual data: met, cam, and USB GHG data. The 7500 and solar panels were super dusty and he cleaned them with his shirt sleeve because we didn’t bring any cleaning supplies from the truck.

The 7500 read: 403ppm CO2, 734mmol/m3 H2O, 19.7C, 101.1kPa, 92SS - 98 after cleaning

We left at 10:05 PST.

Estimated Next Mowing: 2024-11-02

1 photos found

Daphne walking out on newly planted wheat field
20241017BA_DaphneWheatPlanted.jpg ( 2024-10-17 11:01:21 ) Full size: 1920x1440
Daphne walking out on newly planted wheat field

Graphs display:
7 sets found

4 BA_flux graphs found

Explore the graph:Wind in a new window

Explore the graph:LI-7500 CO2 and H2O in a new window

Explore the graph:Counts in a new window

Explore the graph:CO2 in ppm in a new window

21 BA_met graphs found

Explore the graph:Soil Temperatures Set A in a new window

Explore the graph:Soil Temperatures Set B in a new window

Explore the graph:Soil Temperatures Set C in a new window

Explore the graph:Soil Heat Flux in a new window

Explore the graph:Temperature in a new window

Explore the graph:Solar Radiation in a new window

Explore the graph:Air Pressure and RH in a new window

Explore the graph:Soil Moisture in a new window

Explore the graph:PAR in a new window

Explore the graph:PRI Channels in a new window

Explore the graph:NDVI channels in a new window

Explore the graph:Battery Voltage in a new window

Explore the graph:NDVI and PRI in a new window

Explore the graph:Apogee NDVI in a new window

Explore the graph:FD Chamber A CO2 and Temp in a new window

Explore the graph:FD Chamber B CO2 and Temperature in a new window

Explore the graph:Surface Temperature in a new window

Explore the graph:Sentek Soil Moisture profile in a new window

Explore the graph:Sentek Soil Temperature profile in a new window

Explore the graph:Sentek Soil Salinity profile in a new window

Explore the graph:Forced Diffusion Soil CO2 Flux in a new window

6 BA_arable graphs found

Explore the graph:Incoming Solar Bands in a new window

Explore the graph:Reflected Solar Bands in a new window

Explore the graph:Solar Radiation in a new window

Explore the graph:Temperatures, PPT in a new window

Explore the graph:Sentek Deep Soil Moisture in a new window

Explore the graph:Pressure, RH in a new window

Can't check TATWBABCSB_cam
Can't check MBSWEEWPBCBA
No data found for BA_processed.
No data found for BA_adex.