Field Notes
<--2023-07-11 13:55:00 | 2023-08-08 15:40:00-->Other sites visited today: Hill Slough | Bouldin Corn | West Pond | East End | Mayberry | Gilbert Tract
Phenocam link: Searching...
Bouldin Alfalfa: 2023-07-24 12:40:00 (DOY 205)
Author: Daphne Szutu
Others: Ngoc
Summary: Regular data collection/cleaning, alfalfa has been mowed and baled, swapped 7500 for calibration
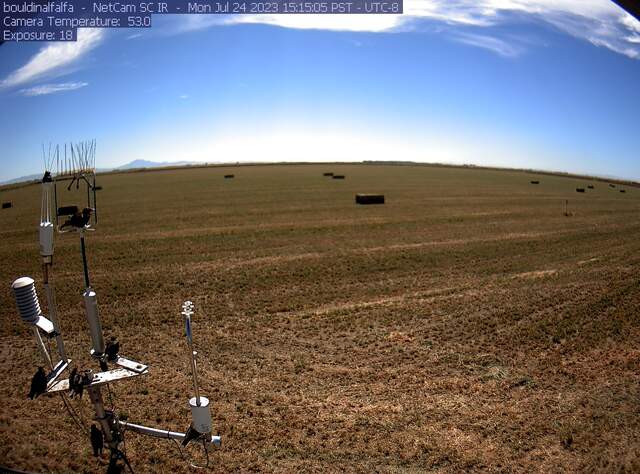
| 2023-07-24 Bouldin Alfalfa Ngoc and I arrived at 12:40 PDT. It was hot, sunny, and clear. Since our last site visit two weeks ago, the alfalfa has been mowed, raked, and baled. The alfalfa is still very short. A tractor was picking up bales on our field during our visit. I checked the undercanopy PAR sensor--it was clear of debris. The fields between us and the barn look like they have all been planted with corn. The plants look younger than our corn plants. While we were there a farm worker in a white truck stopped by to see what we were up to and to ask about the tower. He said that they irrigate maybe 3x/year, whenever they decide the field looks too dry. They open the levee water gates and it takes about 5 days to fill the ditch east of our field. After a few days of subsurface irrigation, they drain our ditch to the main channel north of our field. Too much irrigation and it would be hard to get the tractors on the field. He didn't think our field would be replanted later this year since it's still producing good bales right now. (I will still call Ben to confirm in a few months.) He also didn't know what the construction north of the highway is all about, just said the owners are doing something and he tries to avoid that area because of all the construction traffic. I downloaded the usual data: met, cam, USB GHG, FD, and IRT. I made sure to download the 5min met data since 2023-06-28--it was missing from the download two weeks ago. Ngoc cleaned flux and rad sensors. I cleaned the phenocam window, which had some spiderwebs. We swapped the LI7500A for calibration: sn 0035 came off and sn 75H-2180 went on. I uploaded the new configuration file and updated the pressure coefficients. I changed the eddy clock +45sec from 12:00:15 to 12:01 PST to match the laptop clock and reset the box. All looked ok. 0035 read: 408ppm CO2, 621mmol/m3 H2O, 30.3, 101.5kPa, 96SS 0035 clean read: 413ppm CO2, 571mmol/m3 H2O, 29.8C, 101.5kPa, 98SS 75H-2180 read: 412ppm CO2, 569mmol/m3 H2O, 31.5C, 101.5kPa, 101SS I showed Ngoc how to take spectra measurements on the .jaz. While she was doing that I ran a performance check on the FD chamber as part of its annual routine check. I couldn't remember if I was supposed to "Export Results" or "Apply Offset" first, so I guessed "Export Results." It was the wrong guess as the performance check window closed and I couldn't apply the offset. I re-ran the performance check and made sure to apply the offset first before exporting the results. Both checks were about the same. Average flux was -0.1 with a small standard deviation. Average atm and average soil ppm were within a 5-10ppm of each other. We left at 13:50 PDT. Looking at the data back in the lab, there are some missing photos on the camera card. I will reformat this card before using it again. |
Next Mowing: 2023-09-19
2 photos found

bouldinalfalfa_2023_07_24_151505.jpg ( 2023-07-24 23:17:52 ) Full size: 1296x960
Birds on the eddy senors, bales on the field

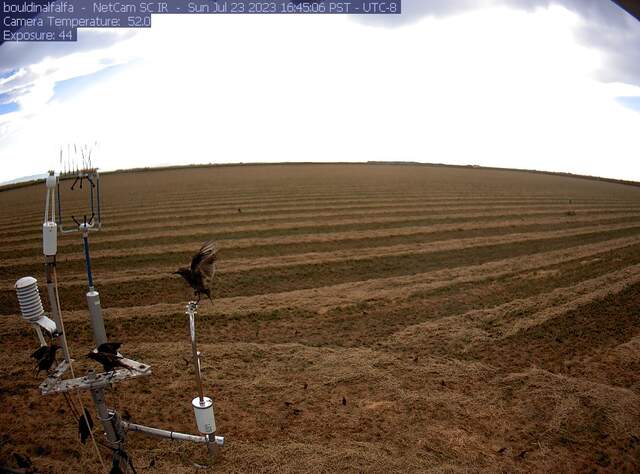
bouldinalfalfa_2023_07_23_164506.jpg ( 2023-07-24 00:48:22 ) Full size: 1296x960
Starlings on eddy sensors
7 sets found
4 BA_flux graphs found
21 BA_met graphs found
6 BA_arable graphs found
Can't check TATWBABCSB_cam
Can't check MBSWEEWPBCBA
2 BA_processed graphs found
No data found for BA_adex.

