Field Notes
<--2023-04-25 14:45:00 | 2023-05-17 13:45:00-->Other sites visited today: Mayberry | Bouldin Corn | Hill Slough
Phenocam link: Searching...
Bouldin Alfalfa: 2023-05-09 13:05:00 (DOY 129)
Author: Daphne Szutu
Others: Kyle
Summary: Regular data collection/cleaning, alfalfa ready to be mowed, trimmed alfalfa under the tower, installed FD chamber
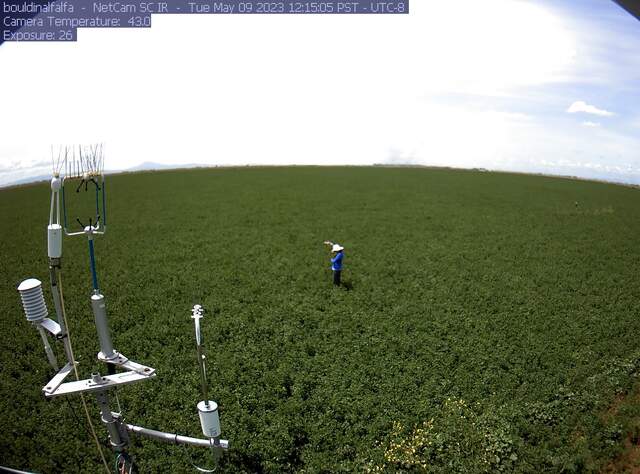
| 2023-05-09 Bouldin Alfalfa Kyle and I arrived at 13:05 PDT. It was partly cloudy and breezy. The alfalfa was tall, lush, and ready to be mowed. I drove into the field and the alfalfa was so tall it felt like we were kayaking through the alfalfa. It smelled like humid plants as soon as we got out of the car. Lots of weeds north of the tower and by the PL Arable. A mower looked like it was about to start mowing the alfalfa field next to us, but saw us there and moved to another field farther away. I trained Kyle on how to take the spectral measurements and she took 10 measurements. The cloud cover was a bit patchy so I'll have to check the reference/up measurements closely. I downloaded met, cam, USB GHG, and IRT data. I installed FD chamber sn FD20180026 that we had just removed from Bouldin Corn. It went in its usual place under the northeast corner of the scaffolding. I plugged it in and heard it pumping. I changed the phenocam clock +2min from 13:31 to 13:33 to match the laptop time. The eddy clock was ok. Kyle cleaned flux and rad sensors and took veg height measurements. She also checked that the PL Arable looked ok. We trimmed the alfalfa under and around the tower and left around 14:15 PDT. |
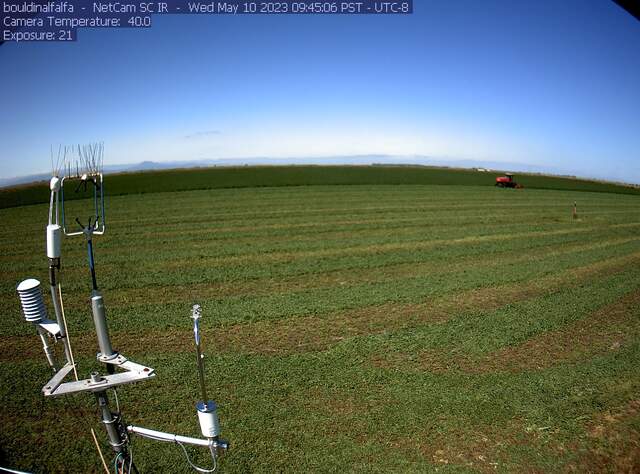
Next Mowing: 2023-05-10
2 photos found

bouldinalfalfa_2023_05_09_121505.jpg ( 2023-05-09 20:18:36 ) Full size: 1296x960
Kyle doing spectral measurements

bouldinalfalfa_2023_05_10_094506.jpg ( 2023-05-10 17:45:54 ) Full size: 1296x960
Field getting mowed
7 sets found
4 BA_flux graphs found
21 BA_met graphs found
6 BA_arable graphs found
Can't check TATWBABCSB_cam
Can't check MBSWEEWPBCBA
2 BA_processed graphs found
No data found for BA_adex.

