Field Notes
<--2023-04-25 11:50:00 | 2023-05-17 10:05:00-->Other sites visited today: Bouldin Corn | Bouldin Alfalfa | Hill Slough
Phenocam link: Searching...
Mayberry: 2023-05-09 09:45:00 (DOY 129)
Author: Daphne Szutu
Others: Kyle
Summary: Regular data collection/cleaning, installed one set of sippers for porewater salinity samples, weeds are very happy
| 2023-05-09 Mayberry Kyle and I arrived at 9:45 PDT. It was mild, breezy, and partly cloudy. The Mayberry Slough water level is low again; I don't think this channel is open to the tides, so I wonder why they're lowering the water level. The interior levee road has been mowed (by a mower) up to our usual parking spot. The hemlock and pepperweeds are huge and lush. The half-rotten plywood I put down last year as mulch didn't do much to keep a clear path. I pulled a few pepperweed out and tried to stomp back the hemlock from our path. We installed some of Ari's porewater "sippers" (M.H.E. SedPoint2s) in the sediment about 2m south of the tower, just across the boardwalk from the tipping bucket. We installed 5 sippers at 10, 20, 30, 40, and 50cm depths and immediately sampled them using a syringe. Two of the sippers had plastic mesh on the ends and three did not. For no particular reason, the two sippers with mesh were installed at the 10cm and 50cm depths. The mesh helps prevent collecting sediments when sampling water, but it can also makes it physically harder to pull up water. The 10cm sipper was ok, but we had to pull hard on the syringe to sample the 50cm sipper. It reminded me that Ari was using a peristaltic pump to sample the sippers in 2020. We measured temperature-compensated conductivity with our handheld YSI EC300A probe. The surface water was about 5 mS/cm and the porewaters were mostly about 9-11 mS/cm. The 40cm depth porewater sample was about the same as the surface water, ~5 mS/cm. We sampled three times just to be sure. We think it's an artifact of installation--I was wiggling the installation tool loose from the soil and probably made the hole too big and surface water flowed down to the sampling point 40cm below the soil surface. Kyle will look at more literature and see how often we should sample the sippers. Veg-black-bare, 10.5mS, 20.3C Veg-black-blue, 11.7mS, 20.8C Veg-black-green, 10.0mS, 21.7C Veg-black-red, 12.3mS, 19.5C Surface, 5.3mS, 19.1C At the tower, I downloaded met, USB GHG, cam, and miniDOT data. I changed hte desiccant for the miniDOT and water level sensor. Kyle cleaned flux and rad sensors and topped up the wash reservoir. I checked the conductivity sensor as part of its routine check every 3 months and confirmed that the orifice was clear. The staff gauge read 59cm. The wetland is continuing to green up. The 7500 read: 425ppm CO2, 4510mmol/m3 H2O, 18.2C, 100.9kPa, 98SS – 101 after cleaning The 7700 read: 2.0ppm CH4, 60RSSI – 82 after cleaning We left at 11:45 PDT. |
1 photos found

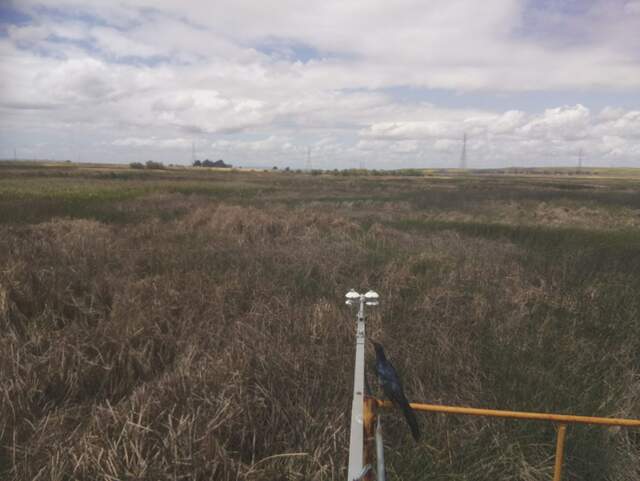
MB_picam_20230508_1145.jpg ( 2023-05-08 11:45:05 ) Full size: 1917x1440
Grackle on railing
11 sets found
7 MB_flux graphs found
No data found for MB_met.
28 MB_tule graphs found
Can't check MBWPEESWGT_mixed
1 MB_cam graphs found
Can't check MBEEWPSWEPGT_cam
Can't check SIMBTWEE_met
1 MB_minidot graphs found
Can't check MBSWEEWPBCBA
1 MB_processed graphs found
Can't check MB_fd
1 MB_fd graphs found

