
Field Notes
<--2023-05-03 16:45:00 | 2023-05-17 15:10:00-->Other sites visited today: Mayberry | Bouldin Corn | Bouldin Alfalfa
Phenocam link: Searching...
Hill Slough: 2023-05-09 15:15:00 (DOY 129)
Author: Daphne Szutu
Others: Kyle
Summary: Regular data collection/cleaning, installed second staff gauge in channel, deployed freshly calibrated EXO, windy!
| 2023-05-09 Hill Slough Kyle and I arrived around 15:15 PDT. It was near low tide and the water was coming in. This was Kyle's first time seeing the channel where the water sensors are. It was sunny and windy with cumulus clouds near the horizon. We started at the channel. I got in the water to install our second staff gauge by the channel. There were a bunch of barnacles growing on the wooden post that I had to scrape off with the bottom of the staff gauge. The mud was also super soft and even though I was only hip deep in water, I was thigh deep in mud. Many bubbles, and many large bubbles, came up as I waded through the mud, kinda like I was in furiously boiling water. In the higher elevation areas without standing water at the moment, we also noticed some bubbles trapped below the algae mat. For the staff gauge, Joe and I had marked the proper height at our last site visit. I put in the top screw (above water) and the middle screw (about 30cm below the water--definitely did not get it orthogonally screwed in). I had to re-do the middle screw because the first time the staff gauge was not quite level. I did not attach the bottom screw because it was too deep. The staff gauge is secured fine, though, barnacles are definitely going to colonize it. The water was super warm--25 deg C! Only about 20cm of the staff gauge was still above water. The staff gauge read 3.35ft around 14:45 PST. It's kind of hard to read while you're standing on the boardwalk though. We deployed the freshly calibrated EXO in the channel. I had to power cycle the DCP signal adapter to get the EXO to boot. The data all seemed ok. There is no pH/ORP sensor right now because the old one has depleted electrode solution and we are waiting for a new sensor (backordered). Sensors installed: sn 22E106072 Turbidity sn 22E100649 fDOM sn 22C103416 EXO2 sn 23D104030 Conductivity/Temperature I downloaded the miniDOT data and swapped its desiccant. There's a small hole in the pantyhose at the bottom. We started at the tower around 16:15 PDT. I downloaded met, cam, and USB GHG data. Kyle cleaned flux and rad sensors and topped off the wash reservoir. The 7500 read: 410ppm CO2, 520mmol/m3 H2O, 19.8C, 101.6kPa, 99SS--101 after cleaning The 7700 read: 2.0ppm CH4, 43RSSI-- 73 after cleaning We left around 16:30 PDT. |
3 photos found
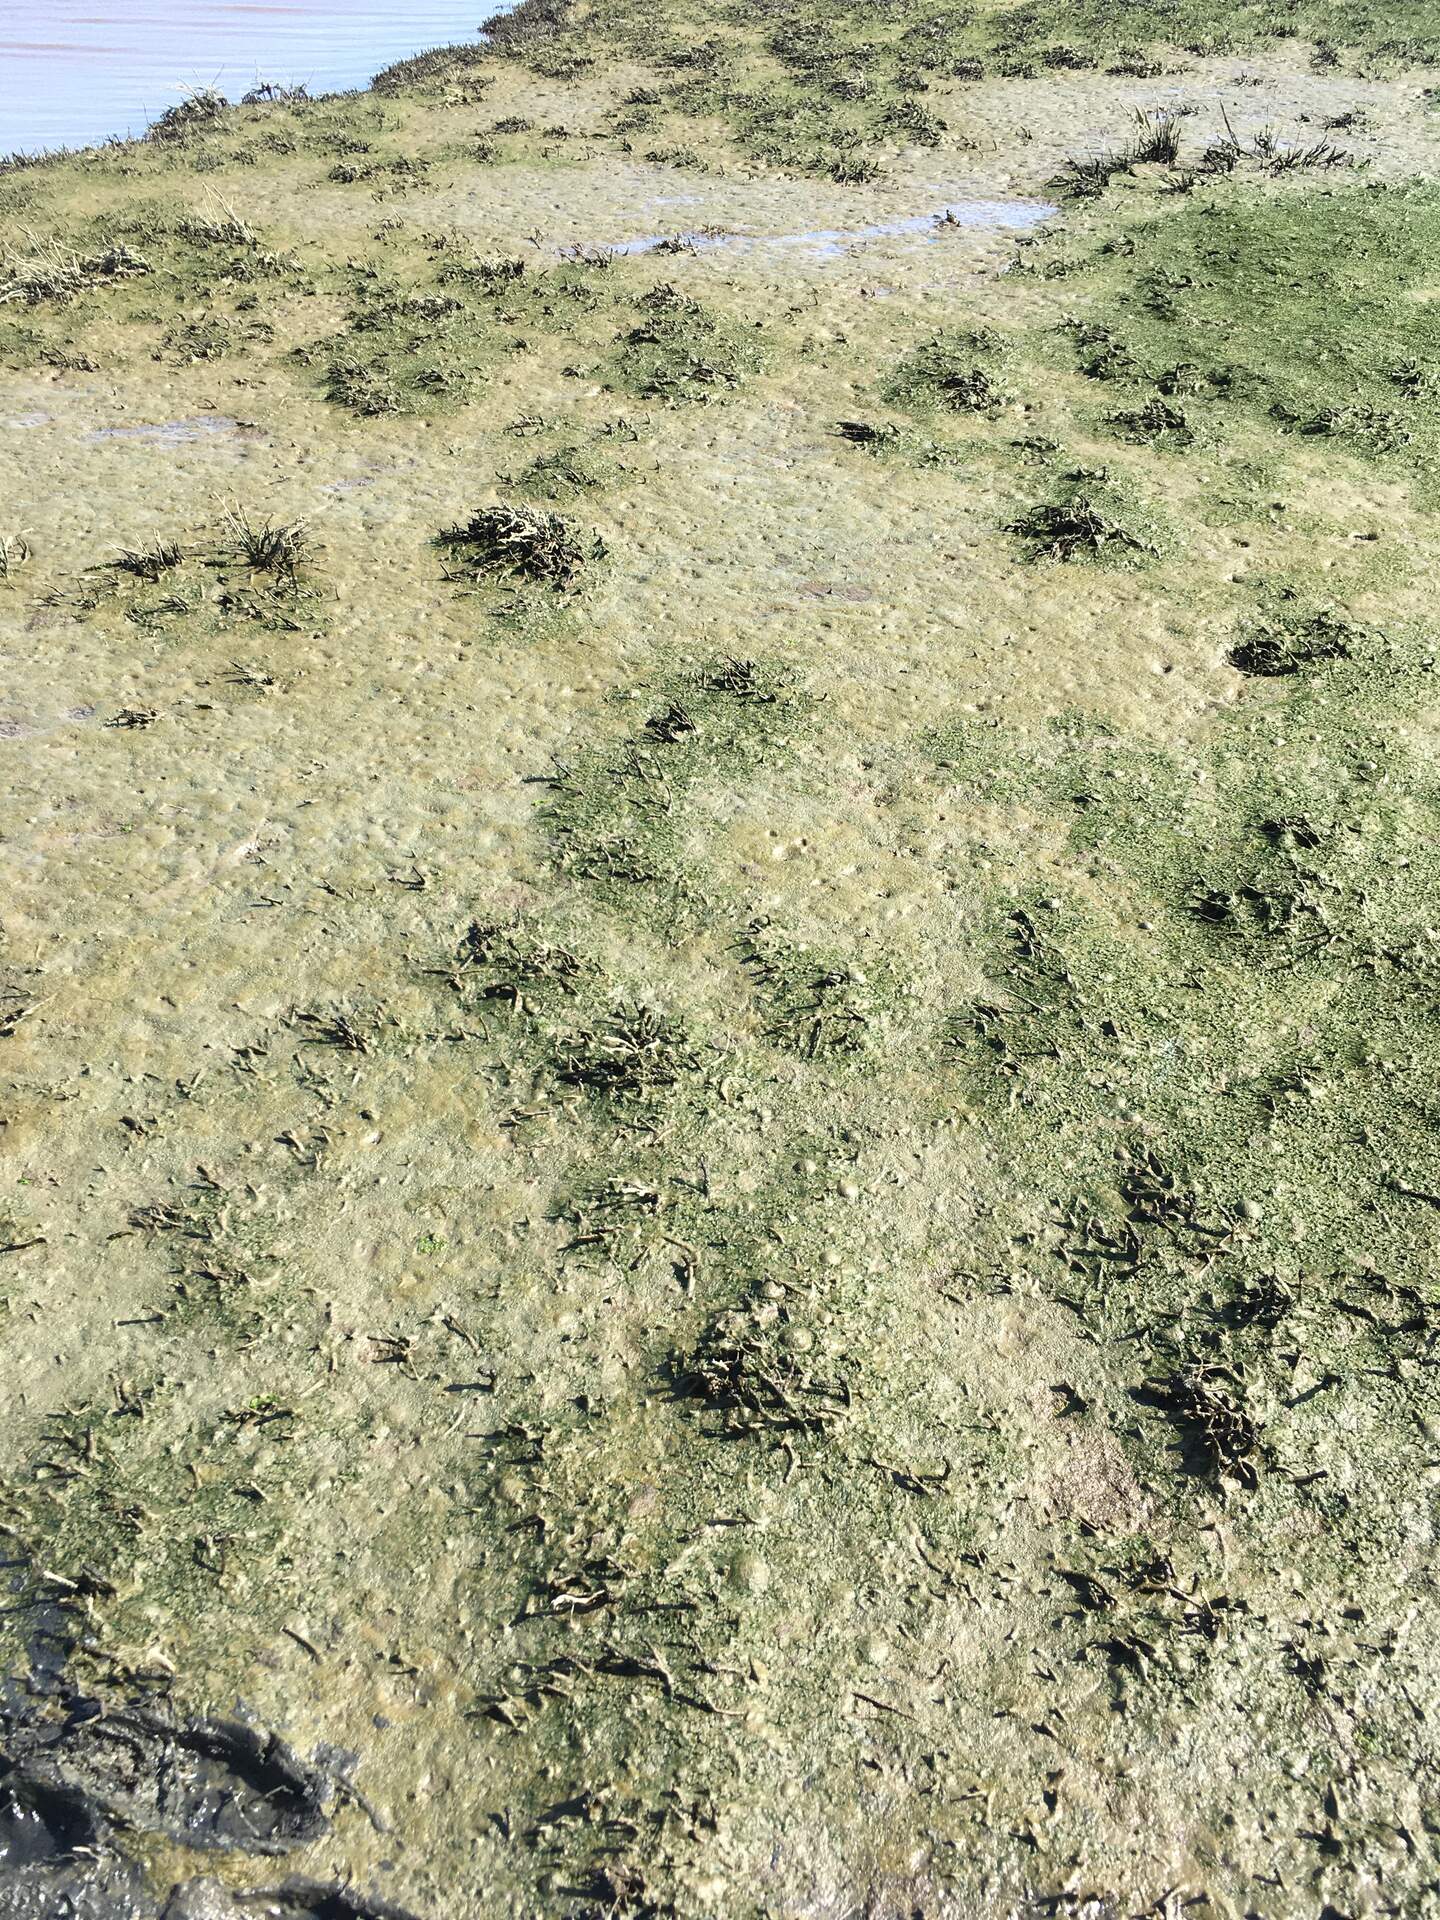
20230509HS_Bubbles1.jpg ( 2023-05-09 16:28:03 ) Full size: 1440x1920
Bubbles getting trapped in the algal mat at Hill Slough during low tide

20230509HS_Bubbles2.jpg ( 2023-05-09 16:28:08 ) Full size: 1440x1920
(Zoomed in) bubbles getting trapped in the algal mat at Hill Slough during low tide
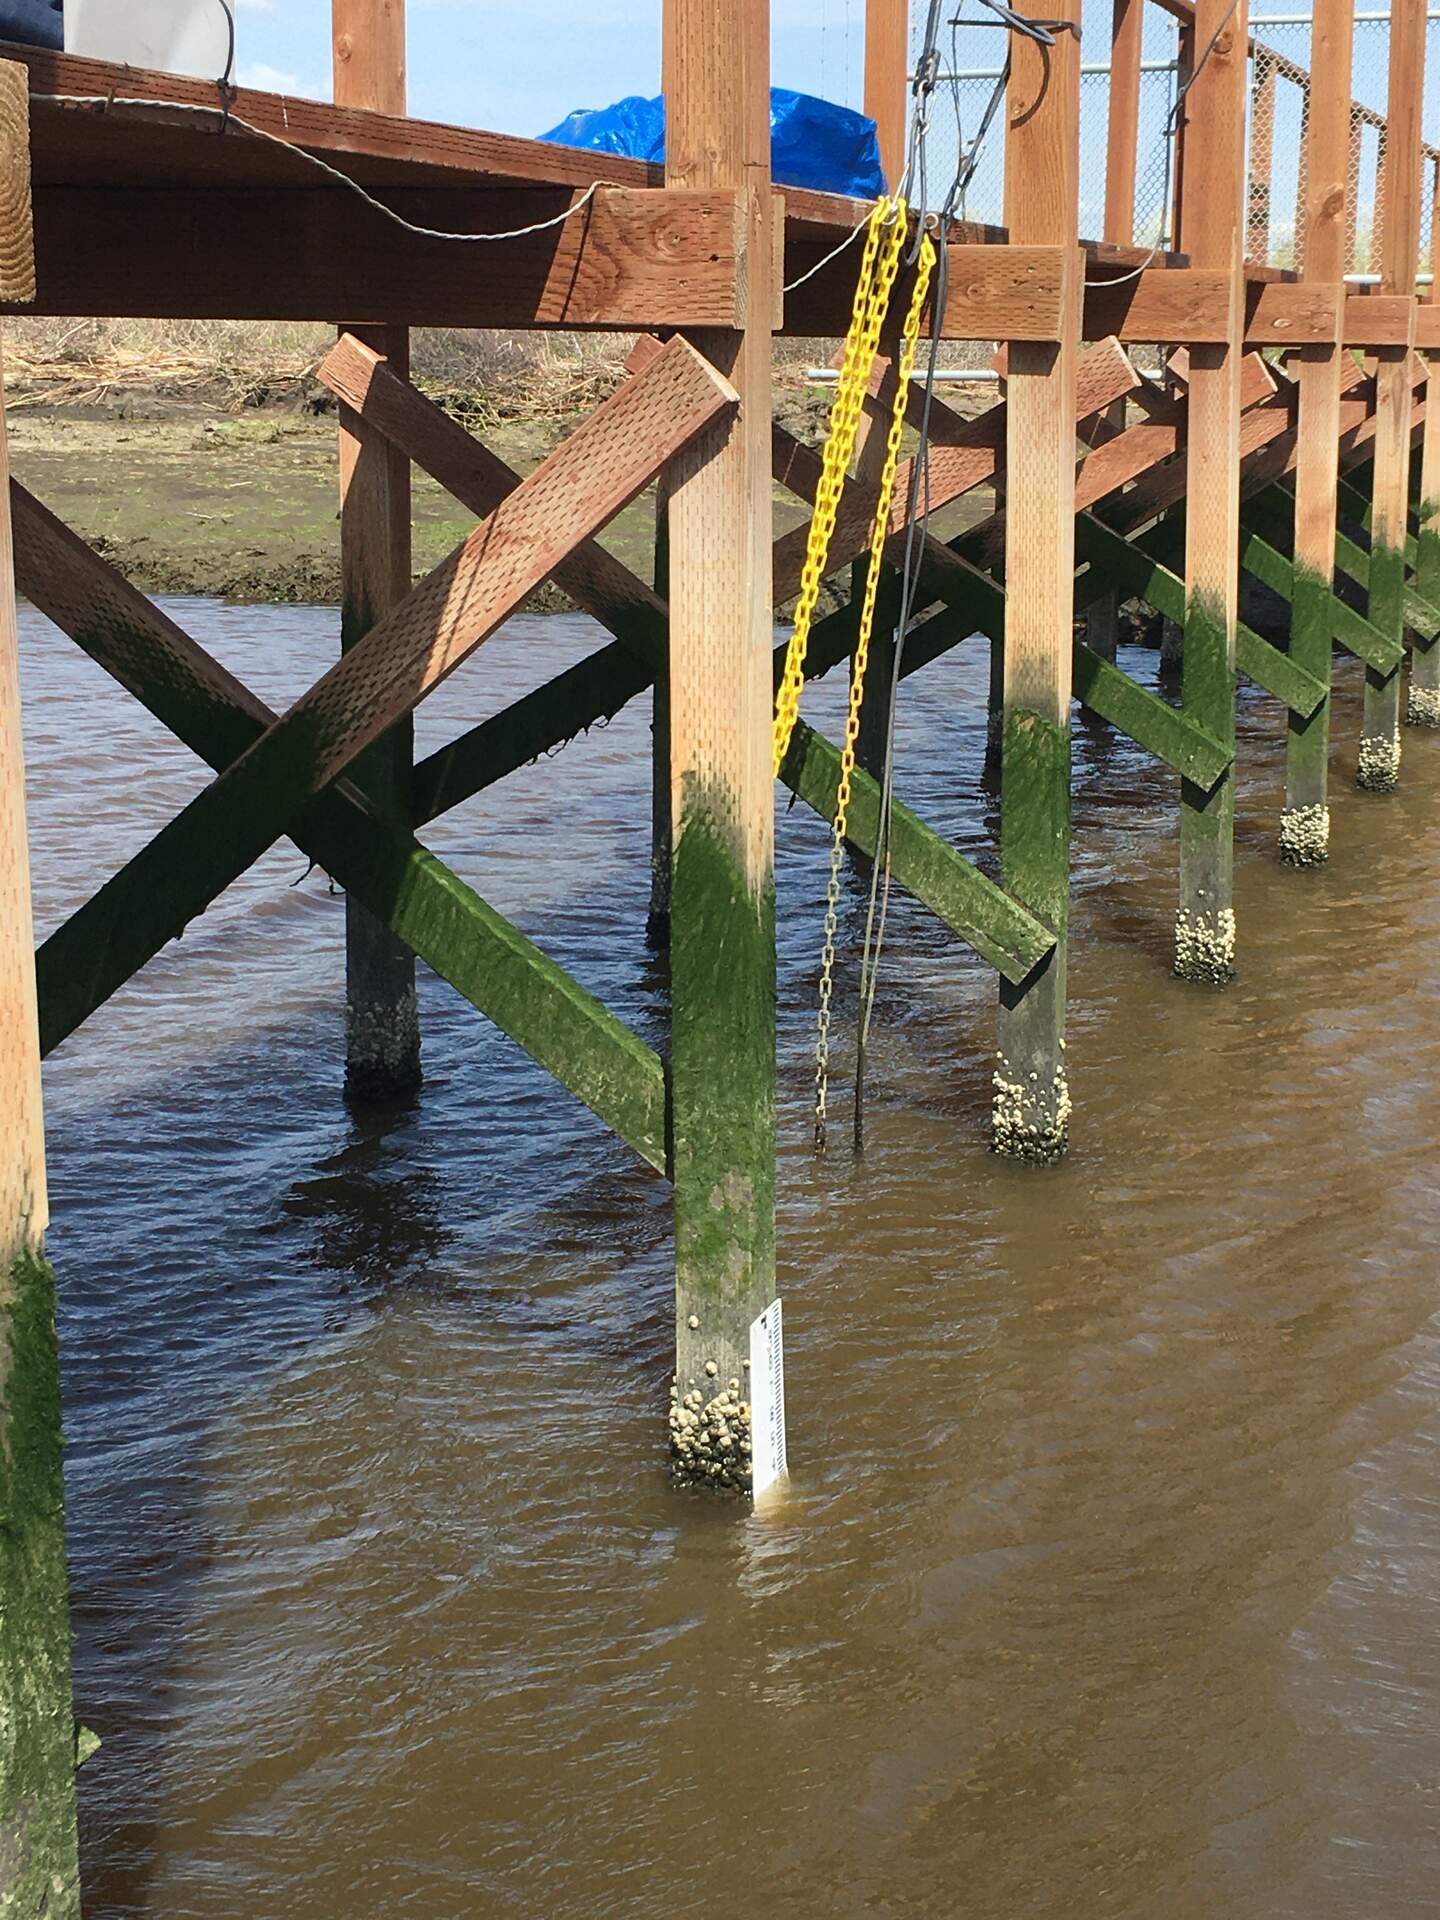
20230509HS_StaffGauge.jpg ( 2023-05-09 15:44:06 ) Full size: 1440x1920
Installed a second staff gauge in the channel to let us read water level during low tide when our primary staff gauge by the tower is high and dry. I had to scrape off a bunch of barnacles before attaching the gauge to the post.
4 sets found
21 HS_met graphs found
4 HS_flux graphs found
1 HS_cam graphs found
Can't check HS_Processed
2 HS_Processed graphs found