
Field Notes
<--2023-05-09 13:05:00 | 2023-05-31 17:10:00-->Other sites visited today: Gilbert Tract | Mayberry | West Pond | East End | Bouldin Corn | Hill Slough
Phenocam link: Searching...
Bouldin Alfalfa: 2023-05-17 13:45:00 (DOY 137)
Author: Daphne Szutu
Others: Robert
Summary: Regular data collection/cleaning, field getting raked/baled
| 2023-05-17 Bouldin Alfalfa Robert and I arrived at 13:45 PDT. It was breezy, sunny, and warm. The field was in the process of getting raked and baled when we arrived. The raker was almost done with the whole field and the baler was maybe 1/4 of the way through the field. We waited a few minutes by the side of the road on the northeast corner of the field. When the baler drove by our corner, Robert hopped out and asked him if there was a good place for us to park on the field without being in the way. The baler told him the "third row" by the PL Arable would be ok since the raker had already been there. The baler moved on to another field and we drove on to park by the PL Arable. The raker drove by both sides of the tower while we were there--those raking wheels sure look larger when they're flying by you. I downloaded met, cam, USB GHG, FD, and IRT data. Robert cleaned flux and met sensors and pulled a few mustard plants growing under the Arable. I changed the eddy clock +1:15min to match the laptop time; when it was 12:53 I changed it to ~12:54 and restarted logging. The 7500 read: 424ppm CO2, 585mmol/m3 H2O, 30.1C, 101.1kPa, 98.5SS after cleaning We removed some leftover hay from under the radiometers that the raker had missed. We left at 14:05 PDT. |
Next Mowing: 2023-06-12
1 photos found
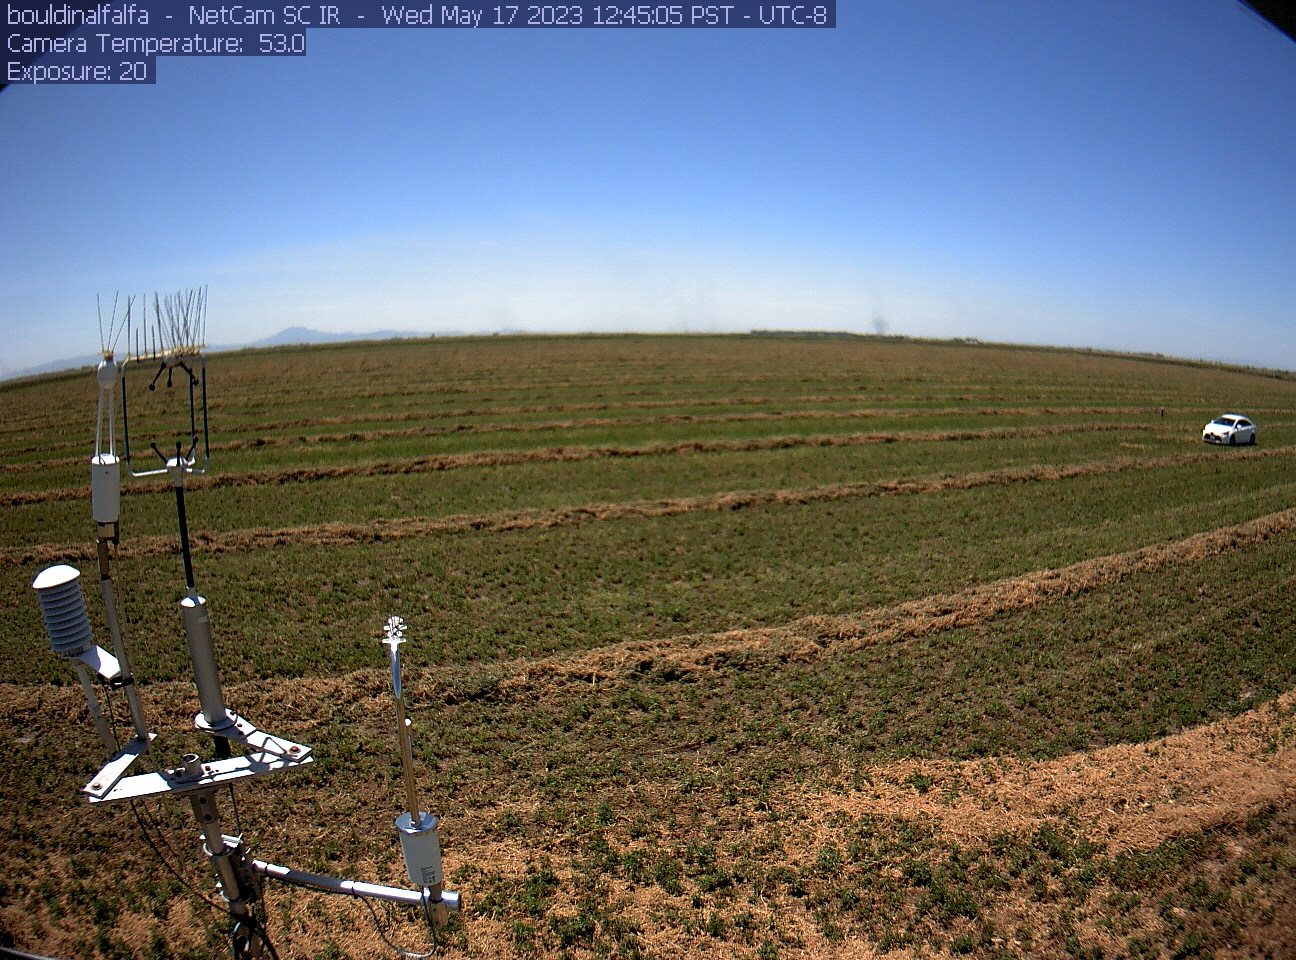
bouldinalfalfa_2023_05_17_124505.jpg ( 2023-05-17 20:46:22 ) Full size: 1296x960
Fieldwork, field recently raked
7 sets found
4 BA_flux graphs found
21 BA_met graphs found
6 BA_arable graphs found
Can't check TATWBABCSB_cam
Can't check MBSWEEWPBCBA
2 BA_processed graphs found
No data found for BA_adex.