Field Notes
<--2021-04-15 11:25:00 | 2021-05-13 10:55:00-->Other sites visited today: Hill Slough | Bouldin Alfalfa | East End | West Pond | Sherman Wetland | Mayberry
Phenocam link: Searching...
Bouldin Corn: 2021-04-27 12:05:00 (DOY 117)
Author: Daphne Szutu
Others:
Summary: Regular data collection/cleaning, super windy, laptop blown off tower, changed eddy clocks +1min, changed phenocam clock +1min
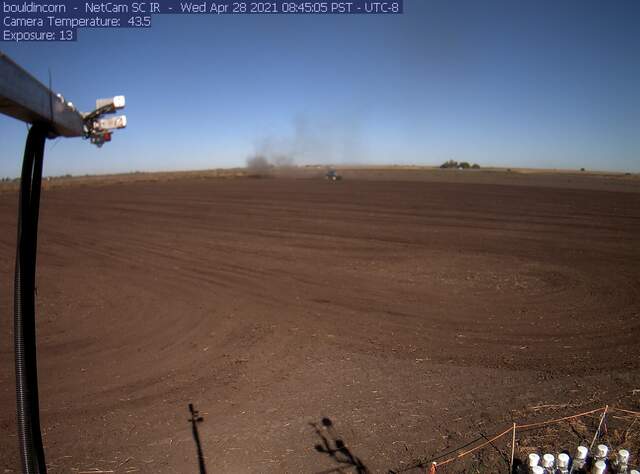
| 2021-04-27 Bouldin Corn I arrived at 12:05 PDT. It was sunny and super windy. Lots of dust in the air from plowing in the fields north of the tower. I had been planning to check the well water level, but the well was dry at the bottom. There were a few sprinkles of rain a few days ago on Sunday, but that might be the last of the rain for this season. I placed the open laptop on top of the met box and almost immediately wind blew it onto the ground. The laptop and cables seemed ok, but the ethernet jack on the laptop is a little busted. The metal frame around the jack bent off. I can still connect the Licor ethernet cable to it, but it’s not as secure so a small jostle can disconnect it. I downloaded met, cam, and USB GHG data. I downloaded the FD data and cleared its memory. I downloaded PA data and power-cycled it. I cleaned flux and rad sensors. The spars on the eddy sensors were pretty dirty and SWin and LWin sensors were muddy. I topped off the wash reservoir. There were some NANs in the NDVI and PRI data, so I power-cycled all those sensors. Next time, I need a longer screw terminal that can connect 8 wires to C7. I synced the eddy and phenocam clocks with the laptop time: I changed the eddy clock from 11:25 to 11:26 and changed the phenocam clock from 11:34 to 11:35. I reset the 7550 box and confirmed the USB was logging and the 7700 was connected. LI-7500 readings: CO2 372ppm H2O 587ppm T 22.5C P 101.5kPa SS 95-->99 after cleaning LI7700 readings: CH4 2.0 RSSI 34-->74 after cleaning I left at 12:50 PDT. |
1 photos found

bouldincorn_2021_04_28_084505.jpg ( 2021-04-28 08:46:08 ) Full size: 1296x960
Tractor maybe disking
6 sets found
17 BC_met graphs found
5 BC_flux graphs found
Can't check TATWBABCSB_cam
Can't check MBSWEEWPBCBA
2 BC_pa graphs found
1 BC_arable graphs found

