Field Notes
<--2021-04-01 10:30:00 | 2021-04-27 12:05:00-->Other sites visited today: Sherman Wetland | Hill Slough | Bouldin Alfalfa | East End | West Pond | Mayberry | Sherman Wetland | Sherman Wetland
Phenocam link: Searching...
Bouldin Corn: 2021-04-15 11:25:00 (DOY 105)
Author: Daphne Szutu
Others:
Summary: Regular data collection/cleaning, our patch being disked, added Apogee NDVI sensors, updated LI-7550 firmware to v8.8.32
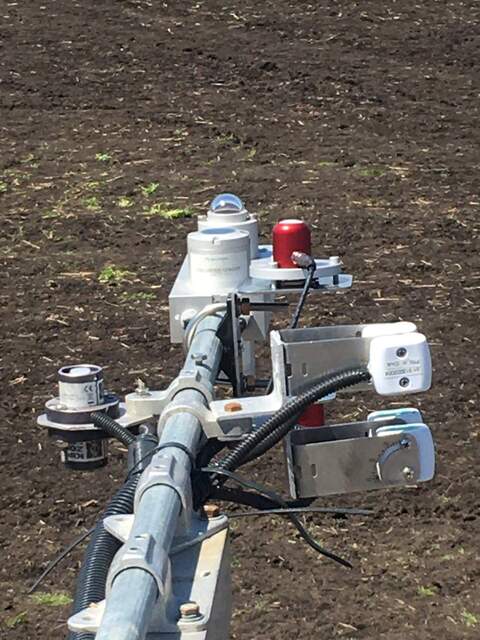
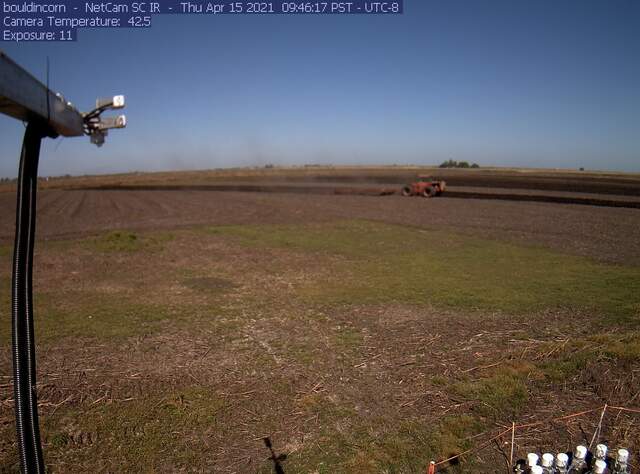
| 2021-04-15 Bouldin Corn I arrived at 11:25 PDT. It was breezy and sunny with hazy horizons. The farmer was disking the field when I arrived, including our previously undisturbed patch west of the tower. He went through each section of the field at least twice. The temporary connection on the serial-USB cable broke, so I re-soldered it again. I need to make this fix more permanent before the next field visit. I downloaded met, camera, and USB GHG data. I downloaded the FD data and cleared its memory. I downloaded the PA data and power-cycled it. The wash reservoir was 20% empty; I refilled it. I cleaned flux and rad sensors. The barometer reading jumped up on the night of 3/30 and now is more similar to the 7550 and 7700 pressure reading. The barometer data overall looks weird since the tower fell down at the end of January, but maybe it's ok now. I added the Apogee NDVI sensors: sn 1051 is in the incoming position and sn 1052 is in the outgoing position. The Decagon/METER NDVI sensors are degrading and now output a negative NDVI. One of the VWC had dropped suddenly from 0.37 to 0.22 in the middle of last week, not sure why. I power-cycled the VWC sensors and the values stayed about the same. There were some NAN values in the NDVI data columns, so I power-cycled the NDVI sensors as well. I updated 7550 sn AIU-1866 firmware from 8.5.0 to 8.8.32. After the update, I checked that the 7700 was connected, the USB was logging, and the GHG columns and eddy clocks looked good. LI-7500 readings: CO2 404ppm H2O 476ppm T 18.5C P 101.6kPa SS 98-->102 after cleaning LI7700 readings: CH4 2.0 RSSI 42-->75 after cleaning I left at 12:35 PDT. |
2 photos found

20210415BC_ApogeeNdvi.jpg ( 2021-04-15 12:31:04 ) Full size: 1440x1920
Apogee NDVI sensors isntalled on BC radiometer boom

bouldincorn_2021_04_15_094505.jpg ( 2021-04-15 09:47:20 ) Full size: 1296x960
Disking
6 sets found
17 BC_met graphs found
5 BC_flux graphs found
Can't check TATWBABCSB_cam
Can't check MBSWEEWPBCBA
2 BC_pa graphs found
1 BC_arable graphs found

