Field Notes
<--2021-04-22 09:00:00 | 2021-05-04 09:40:00-->Other sites visited today: Hill Slough | Bouldin Corn | East End | West Pond | Sherman Wetland | Mayberry
Phenocam link: Searching...
Bouldin Alfalfa: 2021-04-27 13:05:00 (DOY 117)
Author: Daphne Szutu
Others:
Summary: Regular data collection/cleaning, windy day, alfalfa field mowed, trimmed under PL Arables and rad boom, cleaned off undercanopy PAR sensor, spectral measurements, maybe no photos on cam card
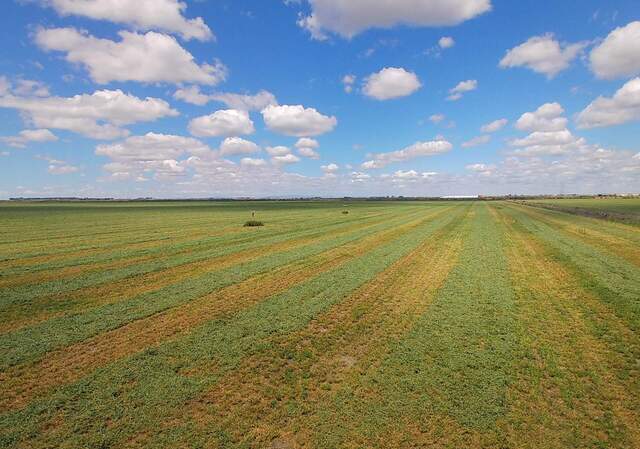
| 2021-04-27 Bouldin Alfalfa I arrived at 13:05 PDT. It was sunny and super windy. Our field and all the alfalfa fields around us have been mowed. I trimmed the alfalfa under the PL Arables and under the radiometer boom, but I left the remaining alfalfa for next time. There were a few sprinkles of rain a few days ago on Sunday, but that might be the last of the rain for this season. I downloaded met, camera, and USB GHG data. I downloaded the FD data and cleared its memory. I topped off the wash reservoir and cleaned the flux and rad sensors. The LWin sensor was muddy but the SWin sensor was clean here. The undercanopy PAR sensor was covered by the mown alfalfa. I cleared the sensor but will need to check it again after raking. I took a few spectral measurements, alternating mowed areas and piled residue areas. LI-7500 readings: CO2 384ppm H2O 507ppm T 22.0C P 101.5kPa SS 94--> 101 after cleaning LI7700 readings: CH4 1.95 RSSI 45--> 88 after cleaning I left at 13:45 PDT. Back in the lab, I discovered there were no photos on the camera card. I’m not sure if I forgot to swap the card or if there’s another problem with the camera or the camera-card connection. |
Next Mowing: 2021-05-28
1 photos found

20210426BA_Arable2.jpg ( 2021-04-26 12:13:00 ) Full size: 1920x1347
Beautiful image from Arable game camera just after mowing
7 sets found
5 BA_flux graphs found
21 BA_met graphs found
6 BA_arable graphs found
Can't check TATWBABCSB_cam
Can't check MBSWEEWPBCBA
2 BA_processed graphs found
No data found for BA_adex.

