Field Notes
<--2021-04-15 10:30:00 | 2021-04-27 15:55:00-->Other sites visited today: Sherman Wetland | Hill Slough | Bouldin Corn | Bouldin Alfalfa | East End | West Pond | Mayberry | Sherman Wetland
Phenocam link: Searching...
Sherman Wetland: 2021-04-15 17:30:00 (DOY 105)
Author: Daphne Szutu
Others:
Summary: Regular data collection/cleaning, conductivity sensor out of the water--fixed, removed intercomparison sonic, changed GHG columns back to normal, dropped desiccant jar in the water
| 2021-04-15 Sherman Wetland I arrived at 17:30 PDT. It was breezy, sunny, and mild. The staff gauge read 88cm. This was the first site visit in a month because I didn’t get to Sherman Island 2 weeks ago. A helicopter alternated between hovering and flying back and forth over Antioch (maybe—it was hard to gauge how far away it was). Camilo, Ariane, and Patty’s student Julie were also at the wetland doing CH4 hotspot measurements in the mudflats and they stopped by around 18:00 to get the LGR data. The conductivity sensor was out of the water and pulled all the way up to the boardwalk, probably by Camilo/Ari when they were getting their inflatable boat in the water earlier today. I lowered the sensor into the water. I removed sonic sn 153805 which was here for an intercomparison after Joe repaired it post its BC dunk. This sonic data had been stored in the 7700 aux columns, and I changed the GHG columns to remove these 4 data columns. I reset the box and checked that the 7700 was connected, the USB was logging, and the GHG columns and eddy clocks looked good. I downloaded met, camera, USB GHG, and miniDOT data. I cleaned flux and rad sensors. The wash reservoir was 1/2 empty; I refilled it. I scrubbed the staff gauge and changed the minidot and water level sensor desiccants. I dropped one of the desiccant jars in the water by the miniDOT, and I’ll have to get it next time with waders. Hopefully it will stay afloat since then. LI-7500 readings: CO2 404ppm H2O 423ppm T 20.8C P 101.5kPa SS 94--> 98 after cleaning LI7700 readings: CH4 2.0ppm RSSI 41--> 82 after cleaning I left at 18:15 PDT. |
7 photos found
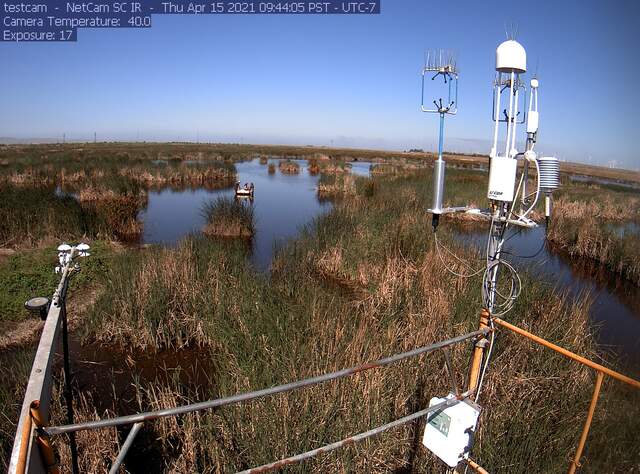
siwetland_2021_04_15_094405.jpg ( 2021-04-15 09:45:36 ) Full size: 1296x960
Camilo, Ari, and Julie sampling open water location
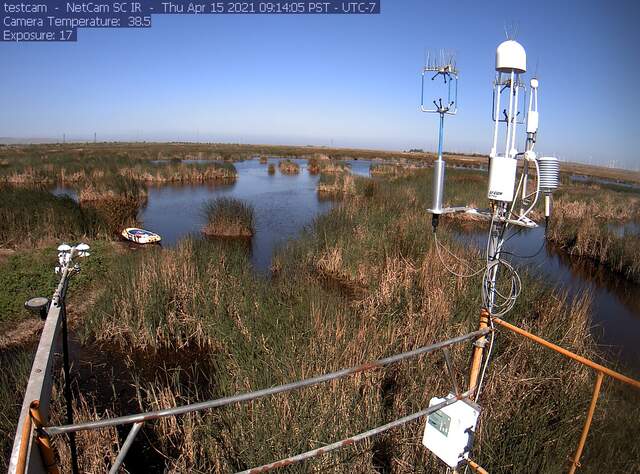
siwetland_2021_04_15_091405.jpg ( 2021-04-15 09:15:38 ) Full size: 1296x960
Inflatable raft used during methane hotspot sampling
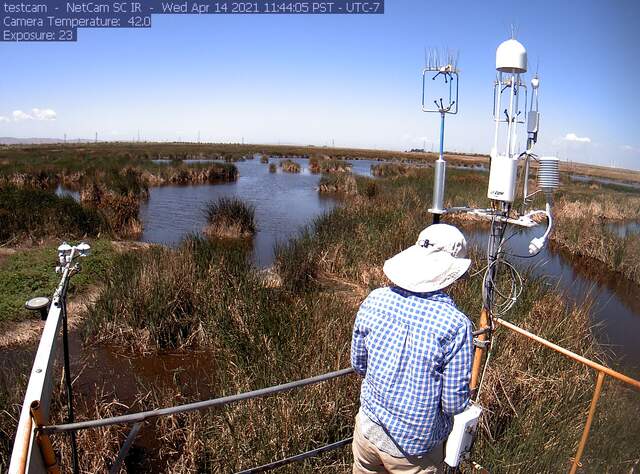
siwetland_2021_04_14_114405.jpg ( 2021-04-14 11:45:46 ) Full size: 1296x960
Patty on site
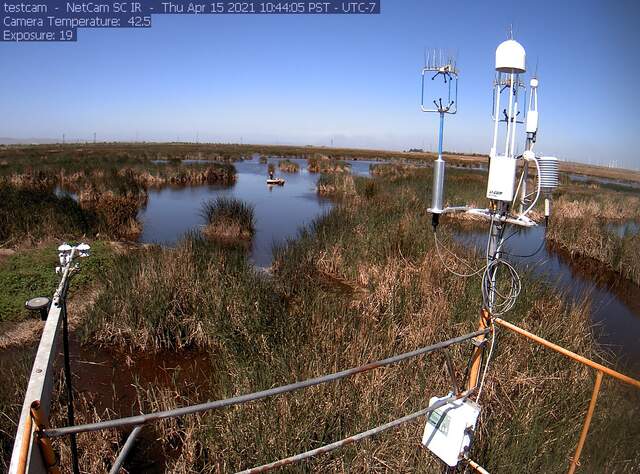
siwetland_2021_04_15_104405.jpg ( 2021-04-15 10:45:38 ) Full size: 1296x960
Methane hotspot sampling
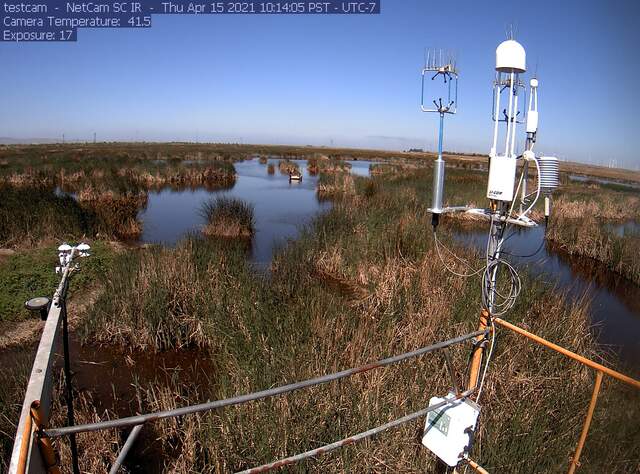
siwetland_2021_04_15_101405.jpg ( 2021-04-15 10:15:48 ) Full size: 1296x960
Methane hot spot sampling
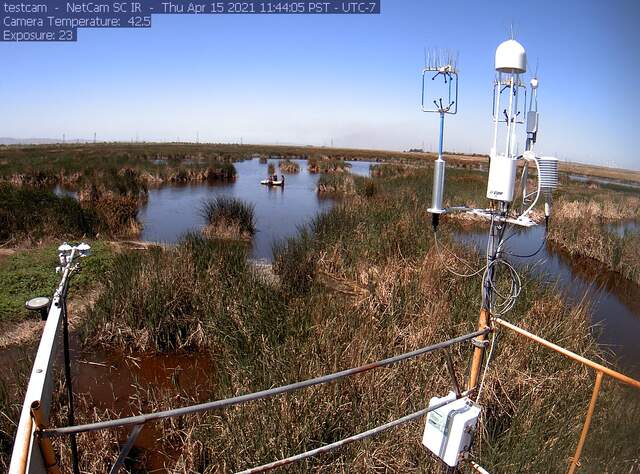
siwetland_2021_04_15_114405.jpg ( 2021-04-15 11:45:38 ) Full size: 1296x960
Methane hotspot sampling
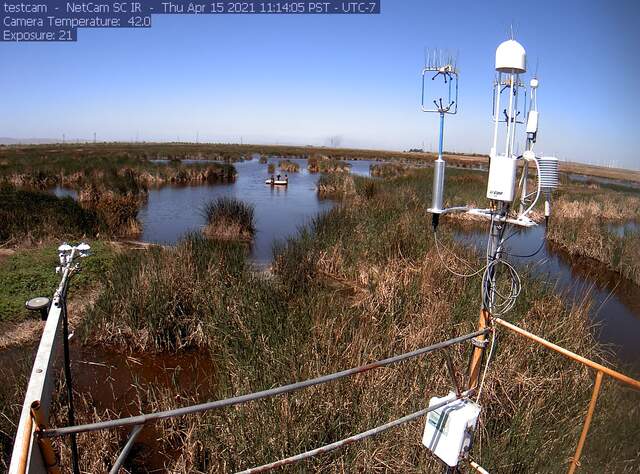
siwetland_2021_04_15_111405.jpg ( 2021-04-15 11:15:46 ) Full size: 1296x960
Methane hotspot sampling
7 sets found
Can't check MBWPEESWGT_mixed
Can't check MBEEWPSWEPGT_cam
16 SW_met graphs found
4 SW_flux graphs found
Can't check MBSWEEWPBCBA
Can't check SW_Temp
14 SW_Temp graphs found
3 SW_arable graphs found

