
Field Notes
<--2021-04-15 09:30:00 | 2021-04-15 17:30:00-->Other sites visited today: Hill Slough | Bouldin Corn | Bouldin Alfalfa | East End | West Pond | Mayberry | Sherman Wetland | Sherman Wetland
Phenocam link: Searching...
Sherman Wetland: 2021-04-15 10:30:00 (DOY 105)
Author: Patty Oikawa
Others: Camilo, Ariane, Julie
Summary: LGR maintenance during methane hotspot chamber sampling
| Arrived 10:30 Laser seems to not be working no stable isotopes showing at all the laser adjustment had automatically switch to -10 (yesterday it was at 2.02) --not sure what’s going on tried running the Cal gas, changed the laser adjustment -didn’t help turned off laser and turned back on-Seems to be working fine now (no idea why) Even water looks OK today running Cal gas at 10:48 AM CO2 = 441.85 ppm D13C = -23.45 per mil D18O= -17.99 per mil H2O= 288.1 ppm gas temperature =44.20 C gas pressure =119.8torr laser response =12.78us Laser adjust now at 1.999 Looks good Back to sampling from tower and D13C and O look low, will wait a few minutes 10:58am- numbers from tower have stabilized and look fine now CO2 = 430.18 ppm D13 C =-18.09 D18O= -73.49 H2O= 918.3ppm Water is looking high again similar to yesterday but the Delta 13 C is looking much better. I will give it 10 more minutes and then run the cal gas again 11:10am ran cal gas again CO2 = 439.67 ppm D13C= -43.77 per mil D18O= -65.6 per mil H2O= 257.9pppm Closed the fridge while the cal gas runs will wait another five minutes and check the tower readings before leaving Our tower readings at 11:21 AM CO2 = 430.35 ppm D13 C = -13.12 per mil D18O=-59.5 per mil H2O =605.3ppm Everything seems fine now, even the water readings. Perhaps some water got into the laser and needed a bit of time to pass through. Camilo , Ari and Julie are still sampling in the footprint. I will leave and Julie will download the data when they finish. |
7 photos found

siwetland_2021_04_15_094405.jpg ( 2021-04-15 09:45:36 ) Full size: 1296x960
Camilo, Ari, and Julie sampling open water location

siwetland_2021_04_15_091405.jpg ( 2021-04-15 09:15:38 ) Full size: 1296x960
Inflatable raft used during methane hotspot sampling
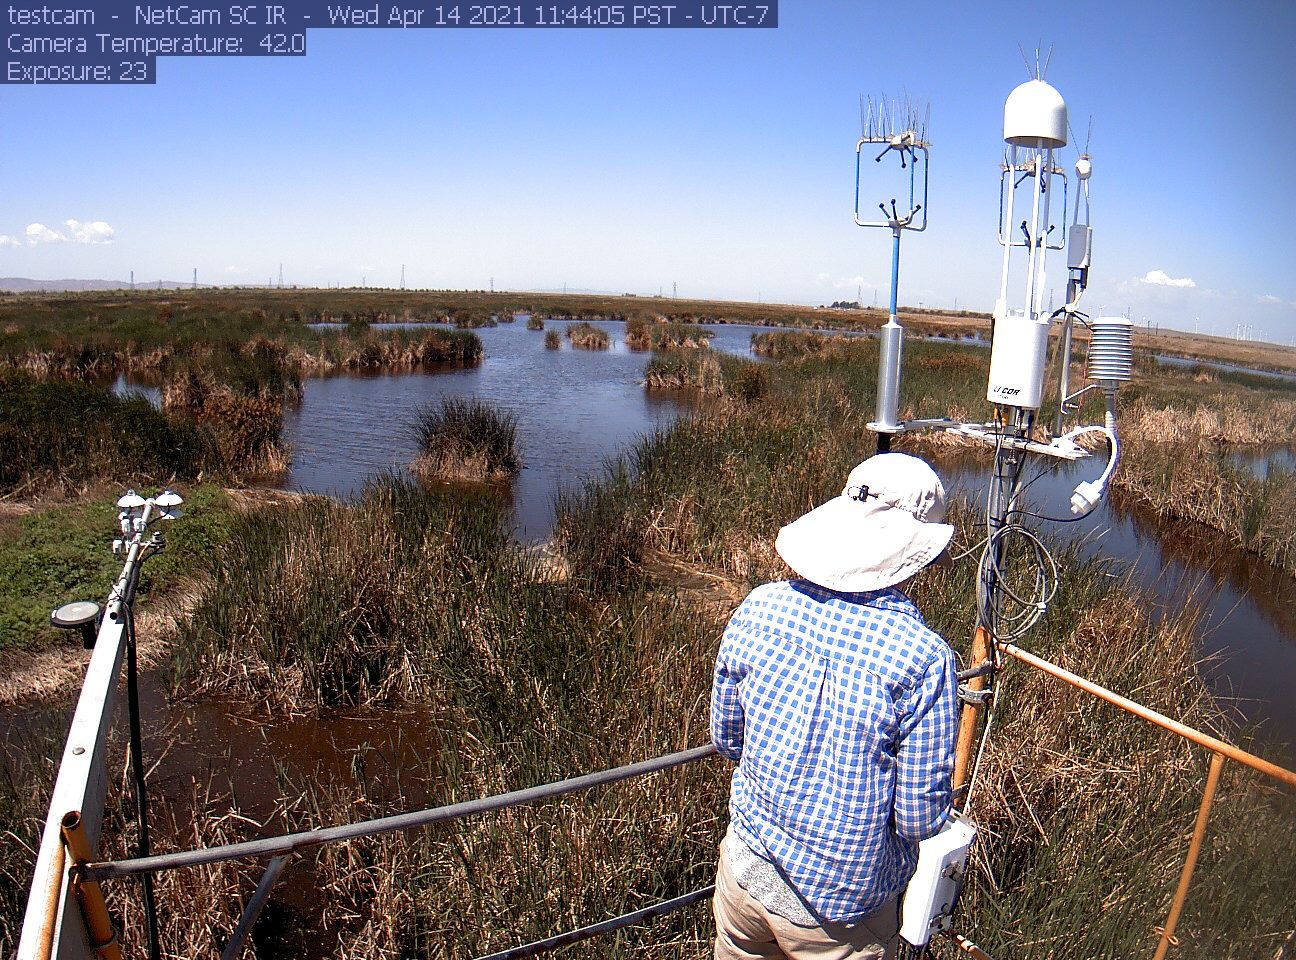
siwetland_2021_04_14_114405.jpg ( 2021-04-14 11:45:46 ) Full size: 1296x960
Patty on site
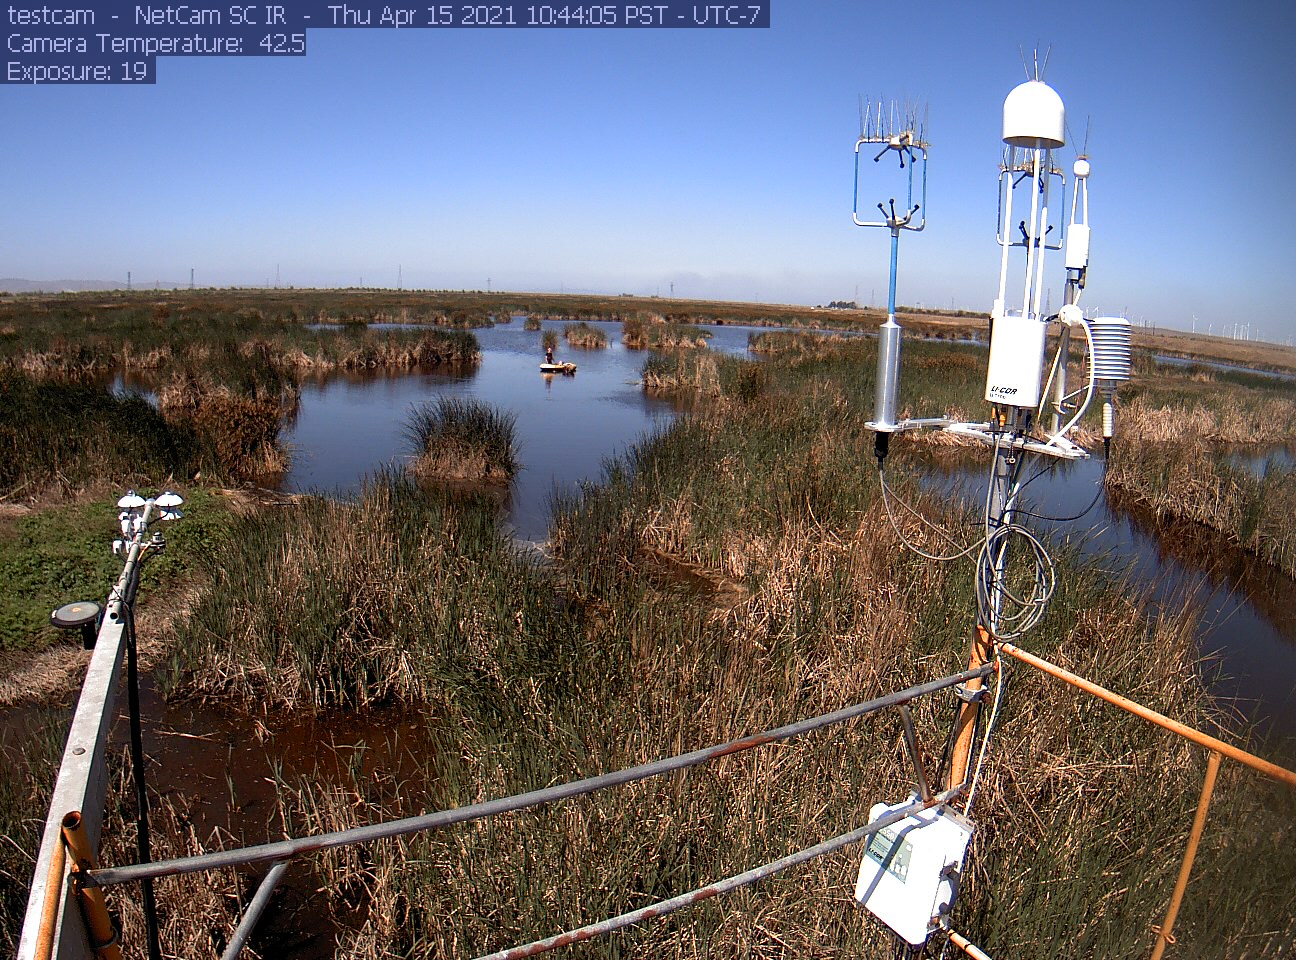
siwetland_2021_04_15_104405.jpg ( 2021-04-15 10:45:38 ) Full size: 1296x960
Methane hotspot sampling
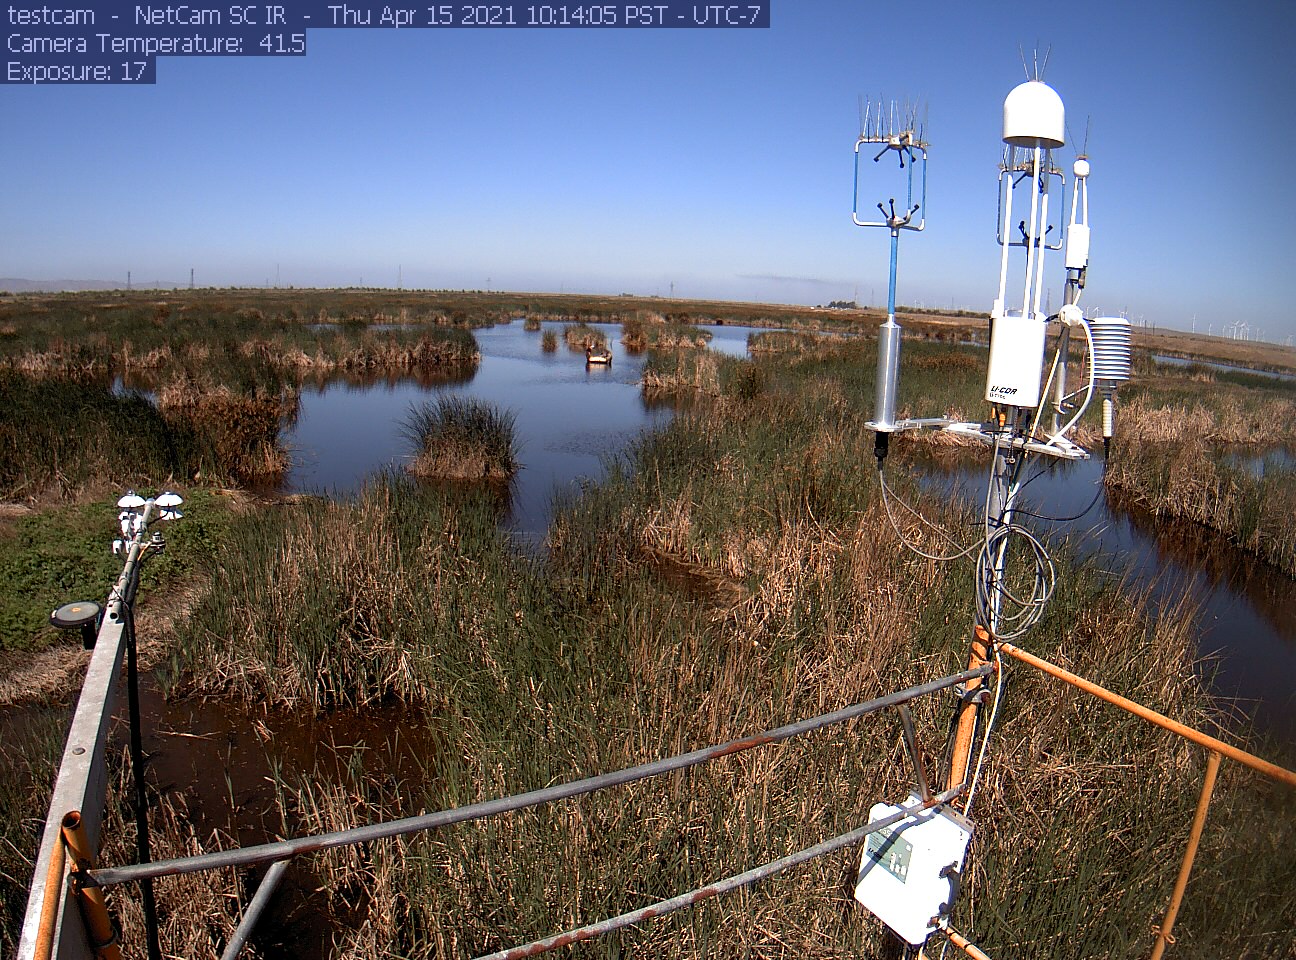
siwetland_2021_04_15_101405.jpg ( 2021-04-15 10:15:48 ) Full size: 1296x960
Methane hot spot sampling

siwetland_2021_04_15_114405.jpg ( 2021-04-15 11:45:38 ) Full size: 1296x960
Methane hotspot sampling

siwetland_2021_04_15_111405.jpg ( 2021-04-15 11:15:46 ) Full size: 1296x960
Methane hotspot sampling
7 sets found
Can't check MBWPEESWGT_mixed
Can't check MBEEWPSWEPGT_cam
16 SW_met graphs found
4 SW_flux graphs found
Can't check MBSWEEWPBCBA
Can't check SW_Temp
14 SW_Temp graphs found
3 SW_arable graphs found