
Field Notes
<--2021-04-14 12:30:00 | 2021-04-15 10:30:00-->Other sites visited today: Sherman Wetland | Hill Slough | Bouldin Corn | Bouldin Alfalfa | East End | West Pond | Mayberry | Sherman Wetland
Phenocam link: Searching...
Sherman Wetland: 2021-04-15 09:30:00 (DOY 105)
Author: Camilo Rey-Sanchez
Others: Ariane
Summary: Hotspot sampling with the Li-7810
| Ariane and I arrived at 9: 30 AM. We inflated the boat and prepared everything for the arrival of Patty and Julie at 10 AM. At 10:30 AM we lowered the boat and the instrument to sample the open water. We sample 4 points in a transect located along the main wind direction. At each point, we sampled 3 replicates. Water temperature was measured with a portable thermometer at each location. We drove to the hotspot location at 2 PM and started sampling at around 2:30 PM. We sampled multiple locations along the boardwalk in the hotspot, including two collars that had been located the previous week. Soil temperature at ~5cm depth was measured with a portable thermometer. After sampling in the boardwalk I went to sample other locations along the levee while Ari and Julie pull porewater samples from a profiler that had been installed the previous week. We finished at around 5:30 PM and met Daphne at the tower for a little bit. |
7 photos found

siwetland_2021_04_15_094405.jpg ( 2021-04-15 09:45:36 ) Full size: 1296x960
Camilo, Ari, and Julie sampling open water location

siwetland_2021_04_15_091405.jpg ( 2021-04-15 09:15:38 ) Full size: 1296x960
Inflatable raft used during methane hotspot sampling
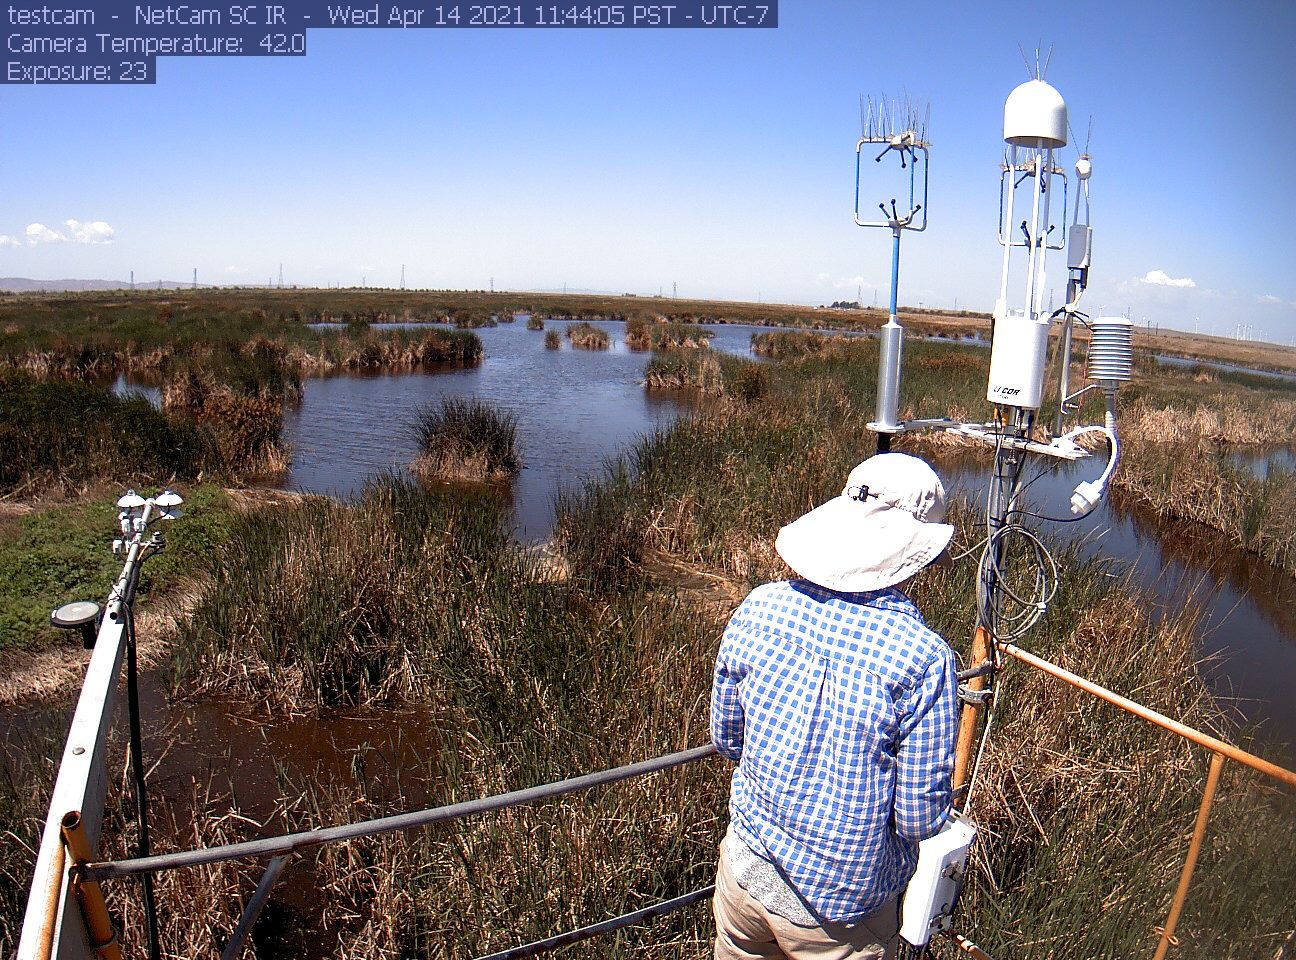
siwetland_2021_04_14_114405.jpg ( 2021-04-14 11:45:46 ) Full size: 1296x960
Patty on site
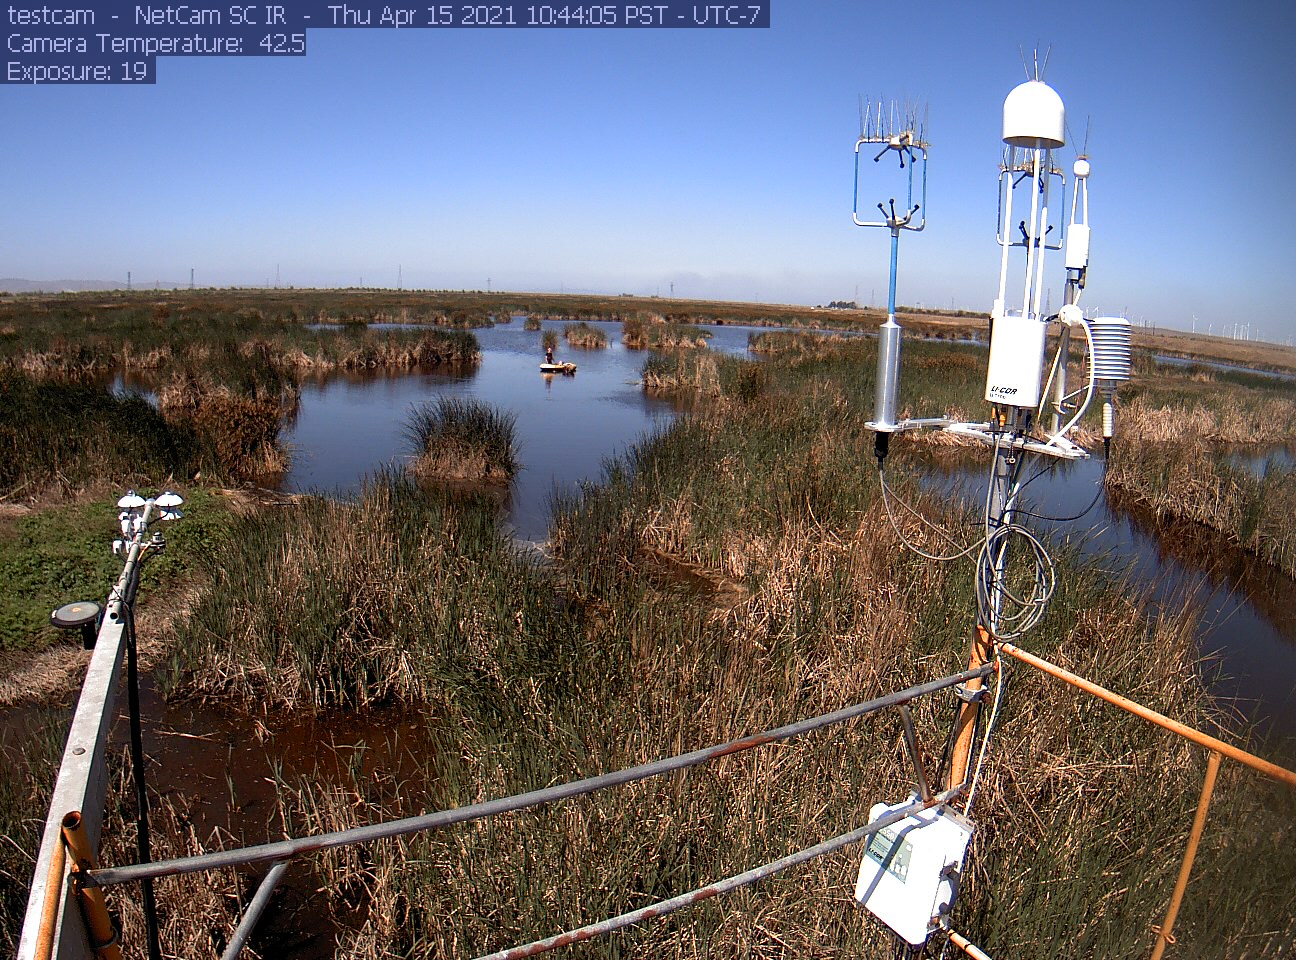
siwetland_2021_04_15_104405.jpg ( 2021-04-15 10:45:38 ) Full size: 1296x960
Methane hotspot sampling
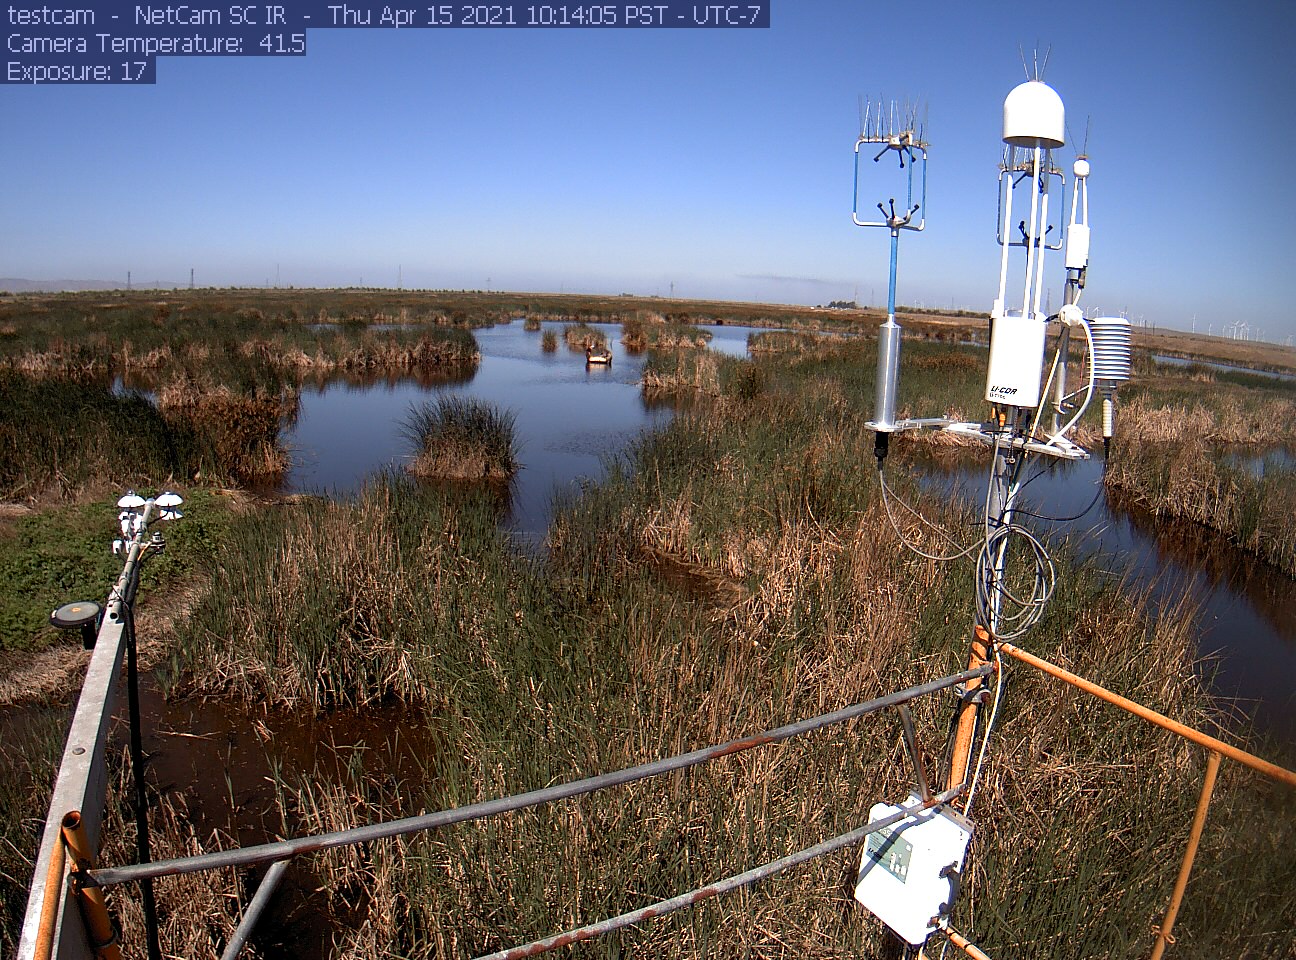
siwetland_2021_04_15_101405.jpg ( 2021-04-15 10:15:48 ) Full size: 1296x960
Methane hot spot sampling

siwetland_2021_04_15_114405.jpg ( 2021-04-15 11:45:38 ) Full size: 1296x960
Methane hotspot sampling

siwetland_2021_04_15_111405.jpg ( 2021-04-15 11:15:46 ) Full size: 1296x960
Methane hotspot sampling
7 sets found
Can't check MBWPEESWGT_mixed
Can't check MBEEWPSWEPGT_cam
16 SW_met graphs found
4 SW_flux graphs found
Can't check MBSWEEWPBCBA
Can't check SW_Temp
14 SW_Temp graphs found
3 SW_arable graphs found