
Field Notes
<--2021-03-30 15:30:00 | 2021-04-18 16:30:00-->Other sites visited today: Sherman Wetland | Hill Slough | Bouldin Corn | Bouldin Alfalfa | West Pond | Mayberry | Sherman Wetland | Sherman Wetland
Phenocam link: Searching...
East End: 2021-04-15 15:00:00 (DOY 105)
Author: Daphne Szutu
Others:
Summary: Regular data collection/cleaning, undercanopy PAR #2 underwater, changed wiring for Apogee NDVI sensors, new CR1000 program, replaced wash reservoir in-line filter, changed eddy clock -5min, updated LI-7550 firmware to v8.8.32, got stung by a wasp
| 2021-04-15 East End I arrived at 15:00 PDT. It was breezy and sunny. More reeds are coming up, but the wetland is still overall brown. The water level is a little higher than last time, and undercanopy PAR #2 was now underwater. I didn’t have waders today to remove the sensor, so I’ll get it next time, or Joe may stop by on his next Tonzi trip. The staff gauge read 47cm. I noticed a plum-sized wasp nest about ½ meter from the met box. I used a dried cattail reed to poke the nest off the dried reeds and got stung on the hand for my troubles. I downloaded met, camera, USB GHG, and miniDOT data. I cleaned flux and rad sensors. The Apogee NDVI sensors still have occasional NANs, despite my new splicing job. I’m wondering if there’s a communication issue because they share a control port with the dfPAR setup. I moved the Apogee NDVI sensors to C7 to join the Decagon/METER NDVI and PRI sensors and the water level sensors. I used a screw terminal to connect all these sensors to the same control port. I updated the CR1000 program to reflect the new wiring. The wash reservoir was empty because of a leaky in-line filter. I replaced the in-line filter and refilled the wash reservoir—doesn’t leak anymore! I checked the 7700 wash spin and spray and all seemed fine. I changed the eddy clocks from 14:51 to 14:46 to match the laptop time. I updated 7550 sn AIU-0397 firmware from 8.5.0 to 8.8.32. After the update, I checked that the 7700 was connected, the USB was logging, and the GHG columns and eddy clocks looked good. LI-7500 readings: CO2 419ppm H2O 311ppm T 24.7C P 101.4kPa SS 107 --> 109 after cleaning --> reset to 100 LI7700 readings: CH4 2.0 after cleaning RSSI 45 --> 77 after cleaning I left at 15:55 PDT. |
1 photos found
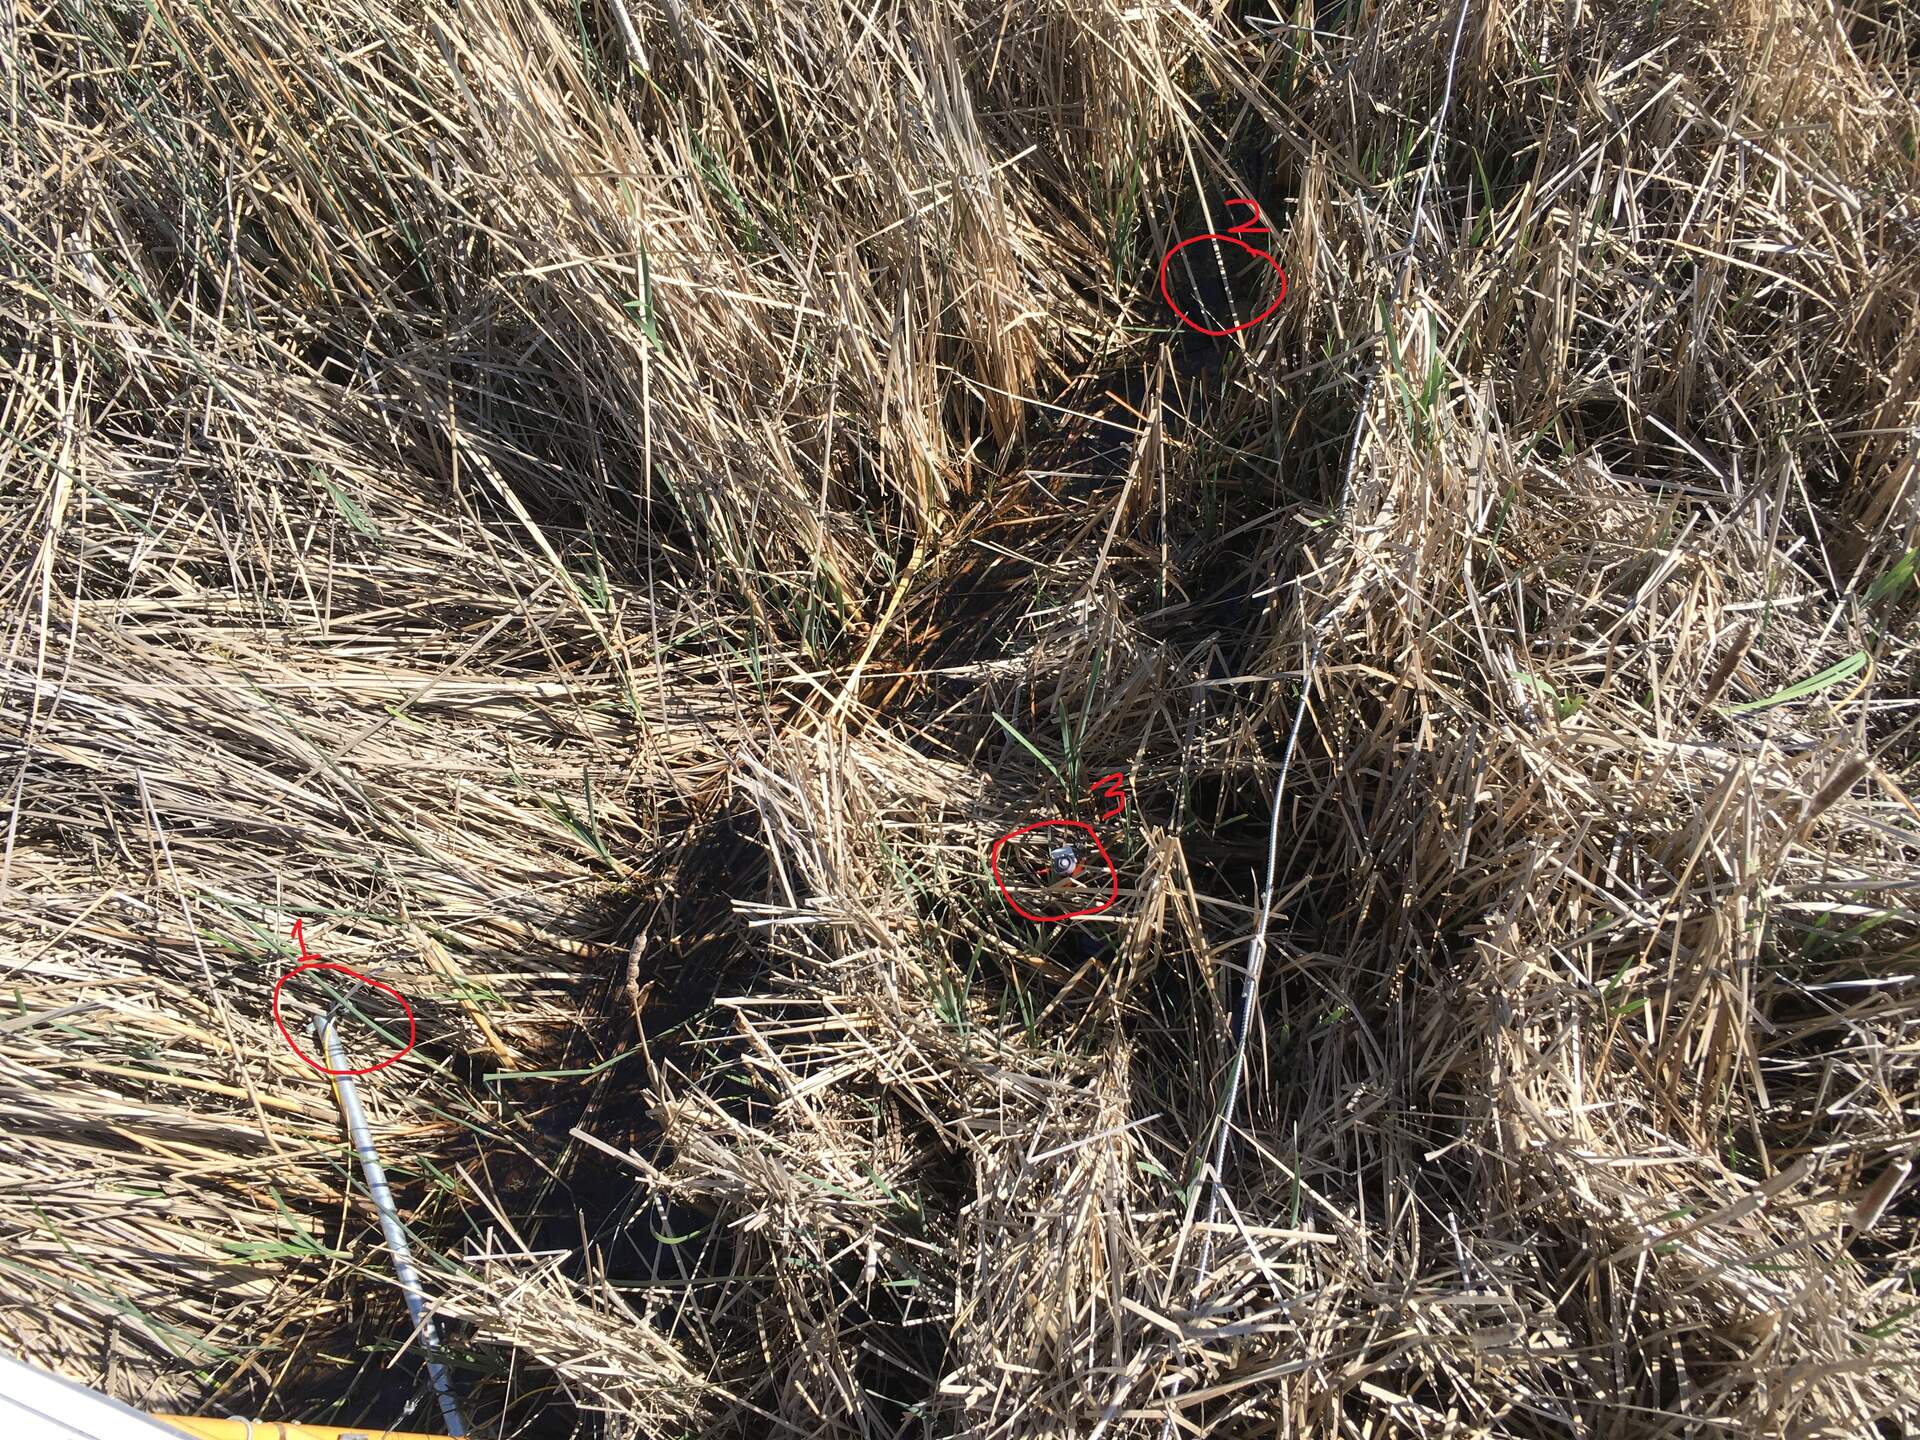
20210415EE_UndercanopyPAR.jpg ( 2021-04-15 15:51:06 ) Full size: 1920x1440
Location of undercanopy PAR sensors on south side of the tower. This is the view when looking down from the upper boardwalk. Undercanopy PAR #2 sensor is currently underwater.
11 sets found
14 EE_met graphs found
Can't check EE_mixed
1 EE_mixed graphs found
8 EE_flux graphs found
Can't check MBWPEESWGT_mixed
1 EE_cam graphs found
Can't check MBEEWPSWEPGT_cam
Can't check SIMBTWEE_met
Can't check EE_Temp
5 EE_Temp graphs found
Can't check EE_minidot
1 EE_minidot graphs found
Can't check MBSWEEWPBCBA
1 EE_processed graphs found