
Field Notes
<--2017-01-17 10:30:00 | 2017-03-02 13:00:00-->Other sites visited today: Tonzi | Sherman Wetland | Mayberry | West Pond | East End | Twitchell Rice | Twitchell Alfalfa
Phenocam link: Searching...
Vaira: 2017-01-31 10:30:00 (DOY 31)
Author: Daphne Szutu
Others: Joe Verfaillie
| We arrived around 10:30am. It was clear and mild. There was thick fog as we drove through the Delta, but it cleared up as soon as we reached Galt. Joe downloaded met data. The computer was having trouble sending data, so he turned off the process that sends photos to see if that would help. I collected soil moisture measurements and cleaned the radiation and CO2 sensors. Joe tested out the radio transmitters by mounting one transmitter on a t-post and hooking the t-post to one of the solar panel poles. He was able to get a signal between the solar panels and the parked truck. The road to the pond was muddy, so we only drove partway to the pond and then walked the rest of the way. There was also a small stream flowing across the road. The pond was full and flowing over the spillway. The stream crossing the spillway was about 5' wide. We downloaded the pond data from the CR10X and Joe tested out the radio transmitters. We did not get a signal from the transmitter by the solar panel, but we got a signal at the top of the road going north(?) from the pond. We could also try installing a metal conduit at the pond datalogger enclosure and attaching the radio receiver to the top. |
Field Data
No tank data
Well Depth
| Date | Location | Depth (feet) |
|---|---|---|
| 2017-01-31 | TZ_floor | 20.83 |
| 2017-01-31 | TZ_road | 28.24 |
| 2017-01-31 | TZ_tower | 23.43 |
| 2017-01-31 | VR_pond | 22.3 |
mode = both
Moisture Point Probes TZ
Array
(
[0] => Tower_1
[1] => Floor_South_1
[2] => Floor_East_1
[3] => Floor_West_1
[4] => SoilCO2_1
[5] => Soil_Transect_4_1
[6] => Soil_Transect_3_1
[7] => Soil_Transect_2_1
[8] => Soil_Transect_1_1
[9] => SoilCO2_West_A_1
[10] => SoilCO2_West_B_1
[11] => SoilCO2_West_C_1
[12] => Tower_2
[13] => Floor_South_2
[14] => Floor_East_2
[15] => Floor_West_2
[16] => SoilCO2_2
[17] => Soil_Transect_4_2
[18] => Soil_Transect_3_2
[19] => Soil_Transect_2_2
[20] => Soil_Transect_1_2
[21] => SoilCO2_West_A_2
[22] => SoilCO2_West_B_2
[23] => SoilCO2_West_C_2
[24] => Tower_3
[25] => Floor_South_3
[26] => Floor_East_3
[27] => Floor_West_3
[28] => SoilCO2_3
[29] => Soil_Transect_4_3
[30] => Soil_Transect_3_3
[31] => Soil_Transect_2_3
[32] => Soil_Transect_1_3
[33] => SoilCO2_West_A_3
[34] => SoilCO2_West_B_3
[35] => SoilCO2_West_C_3
[36] => Tower_4
[37] => Floor_South_4
[38] => Floor_East_4
[39] => Floor_West_4
[40] => SoilCO2_4
[41] => Soil_Transect_4_4
[42] => Soil_Transect_3_4
[43] => Soil_Transect_2_4
[44] => Soil_Transect_1_4
[45] => SoilCO2_West_A_4
[46] => SoilCO2_West_B_4
[47] => SoilCO2_West_C_4
)
| Date | DOY | Rep | Depth | Tower_1 |
Floor_South_1 |
Floor_East_1 |
Floor_West_1 |
SoilCO2_1 |
Soil_Transect_4_1 |
Soil_Transect_3_1 |
Soil_Transect_2_1 |
Soil_Transect_1_1 |
SoilCO2_West_A_1 |
SoilCO2_West_B_1 |
SoilCO2_West_C_1 |
Tower_2 |
Floor_South_2 |
Floor_East_2 |
Floor_West_2 |
SoilCO2_2 |
Soil_Transect_4_2 |
Soil_Transect_3_2 |
Soil_Transect_2_2 |
Soil_Transect_1_2 |
SoilCO2_West_A_2 |
SoilCO2_West_B_2 |
SoilCO2_West_C_2 |
Tower_3 |
Floor_South_3 |
Floor_East_3 |
Floor_West_3 |
SoilCO2_3 |
Soil_Transect_4_3 |
Soil_Transect_3_3 |
Soil_Transect_2_3 |
Soil_Transect_1_3 |
SoilCO2_West_A_3 |
SoilCO2_West_B_3 |
SoilCO2_West_C_3 |
Tower_4 |
Floor_South_4 |
Floor_East_4 |
Floor_West_4 |
SoilCO2_4 |
Soil_Transect_4_4 |
Soil_Transect_3_4 |
Soil_Transect_2_4 |
Soil_Transect_1_4 |
SoilCO2_West_A_4 |
SoilCO2_West_B_4 |
SoilCO2_West_C_4 |
Avg | Spacial Count |
Measurement Count |
|---|---|---|---|---|---|---|---|---|---|---|---|---|---|---|---|---|---|---|---|---|---|---|---|---|---|---|---|---|---|---|---|---|---|---|---|---|---|---|---|---|---|---|---|---|---|---|---|---|---|---|---|---|---|---|
| 2017-01-31 | 31 | 0 | nan | 37.9 | 36.1 | 39.9 | 37 | 39.6 | 31.7 | 21.2 | 25.6 | 32.9 | 36.4 | 35.5 | 34.4 | 43.9 | 40.2 | 50 | 41.1 | 34.1 | 33.8 | 32.9 | 32.3 | 27.7 | 31 | 27.4 | 32.9 | 38 | 42.4 | 39.6 | 40.7 | 44.6 | 39.1 | 33.5 | 36 | 35.7 | 35.7 | 38.8 | 38 | 40.5 | 55.1 | 58.9 | 45.7 | 40.3 | 35.7 | 45.4 | 48.3 | 40 | 44.3 | 50 | 45.7 | |||
| 2017-01-31 | 31 | 1 | nan | 37.6 | 36.1 | 39.9 | 37 | 39.9 | 31.7 | 20.6 | 24.1 | 34.1 | 36.4 | 34.6 | 35.8 | 42.9 | 40.5 | 50 | 40.8 | 33.8 | 33.5 | 32.9 | 32.6 | 26.8 | 31.6 | 27.7 | 33.2 | 38.8 | 43 | 39.7 | 41.6 | 43.3 | 39.6 | 34.3 | 36.6 | 36 | 37.1 | 39.4 | 39.6 | 39.1 | 57.4 | 58.6 | 45.4 | 42 | 35.7 | 45.7 | 49.1 | 40 | 45.4 | 57.4 | 47.7 | |||
| 2017-01-31 | 31 | Avg | 0-15cm | 0 | 0 | |||||||||||||||||||||||||||||||||||||||||||||||||
| 2017-01-31 | 31 | Avg | 15-30cm | 0 | 0 | |||||||||||||||||||||||||||||||||||||||||||||||||
| 2017-01-31 | 31 | Avg | 30-45cm | 0 | 0 | |||||||||||||||||||||||||||||||||||||||||||||||||
| 2017-01-31 | 31 | Avg | 45-60cm | 0 | 0 |
mode = both
Moisture Point Probes VR
Array
(
[0] => Solar_Panels_1
[1] => Flux_Tower_1
[2] => Gate_1
[3] => Biomass_Cage_1
[4] => Solar_Panels_2
[5] => Flux_Tower_2
[6] => Gate_2
[7] => Biomass_Cage_2
[8] => Solar_Panels_3
[9] => Flux_Tower_3
[10] => Gate_3
[11] => Biomass_Cage_3
[12] => Solar_Panels_4
[13] => Flux_Tower_4
[14] => Gate_4
[15] => Biomass_Cage_4
)
| Date | DOY | Rep | Depth | Solar_Panels_1 |
Flux_Tower_1 |
Gate_1 |
Biomass_Cage_1 |
Solar_Panels_2 |
Flux_Tower_2 |
Gate_2 |
Biomass_Cage_2 |
Solar_Panels_3 |
Flux_Tower_3 |
Gate_3 |
Biomass_Cage_3 |
Solar_Panels_4 |
Flux_Tower_4 |
Gate_4 |
Biomass_Cage_4 |
Avg | Spacial Count |
Measurement Count |
|---|---|---|---|---|---|---|---|---|---|---|---|---|---|---|---|---|---|---|---|---|---|---|
| 2017-01-31 | 31 | 0 | nan | 32 | 25.6 | 35.2 | 10.6 | 30.7 | 28.6 | 21 | 22.8 | 31.8 | 17.6 | 24.3 | 32.9 | 42.3 | 30.2 | 22.8 | 32.8 | |||
| 2017-01-31 | 31 | 1 | nan | 31.7 | 25.3 | 34.9 | 10.6 | 30.4 | 28.9 | 21.6 | 22.2 | 31.8 | 17.9 | 24.8 | 32.7 | 43.1 | 30.2 | 22.2 | 32.2 | |||
| 2017-01-31 | 31 | Avg | 0-15cm | 0 | 0 | |||||||||||||||||
| 2017-01-31 | 31 | Avg | 15-30cm | 0 | 0 | |||||||||||||||||
| 2017-01-31 | 31 | Avg | 30-45cm | 0 | 0 | |||||||||||||||||
| 2017-01-31 | 31 | Avg | 45-60cm | 0 | 0 |
No TZ grass heigth found
No VR grass heigth found
No VR Tree DBH found
No water potential data found
No VR Grass Biomass data found
No VR OakLeaves Biomass data found
No VR PineNeedles Biomass data found
1 photos found
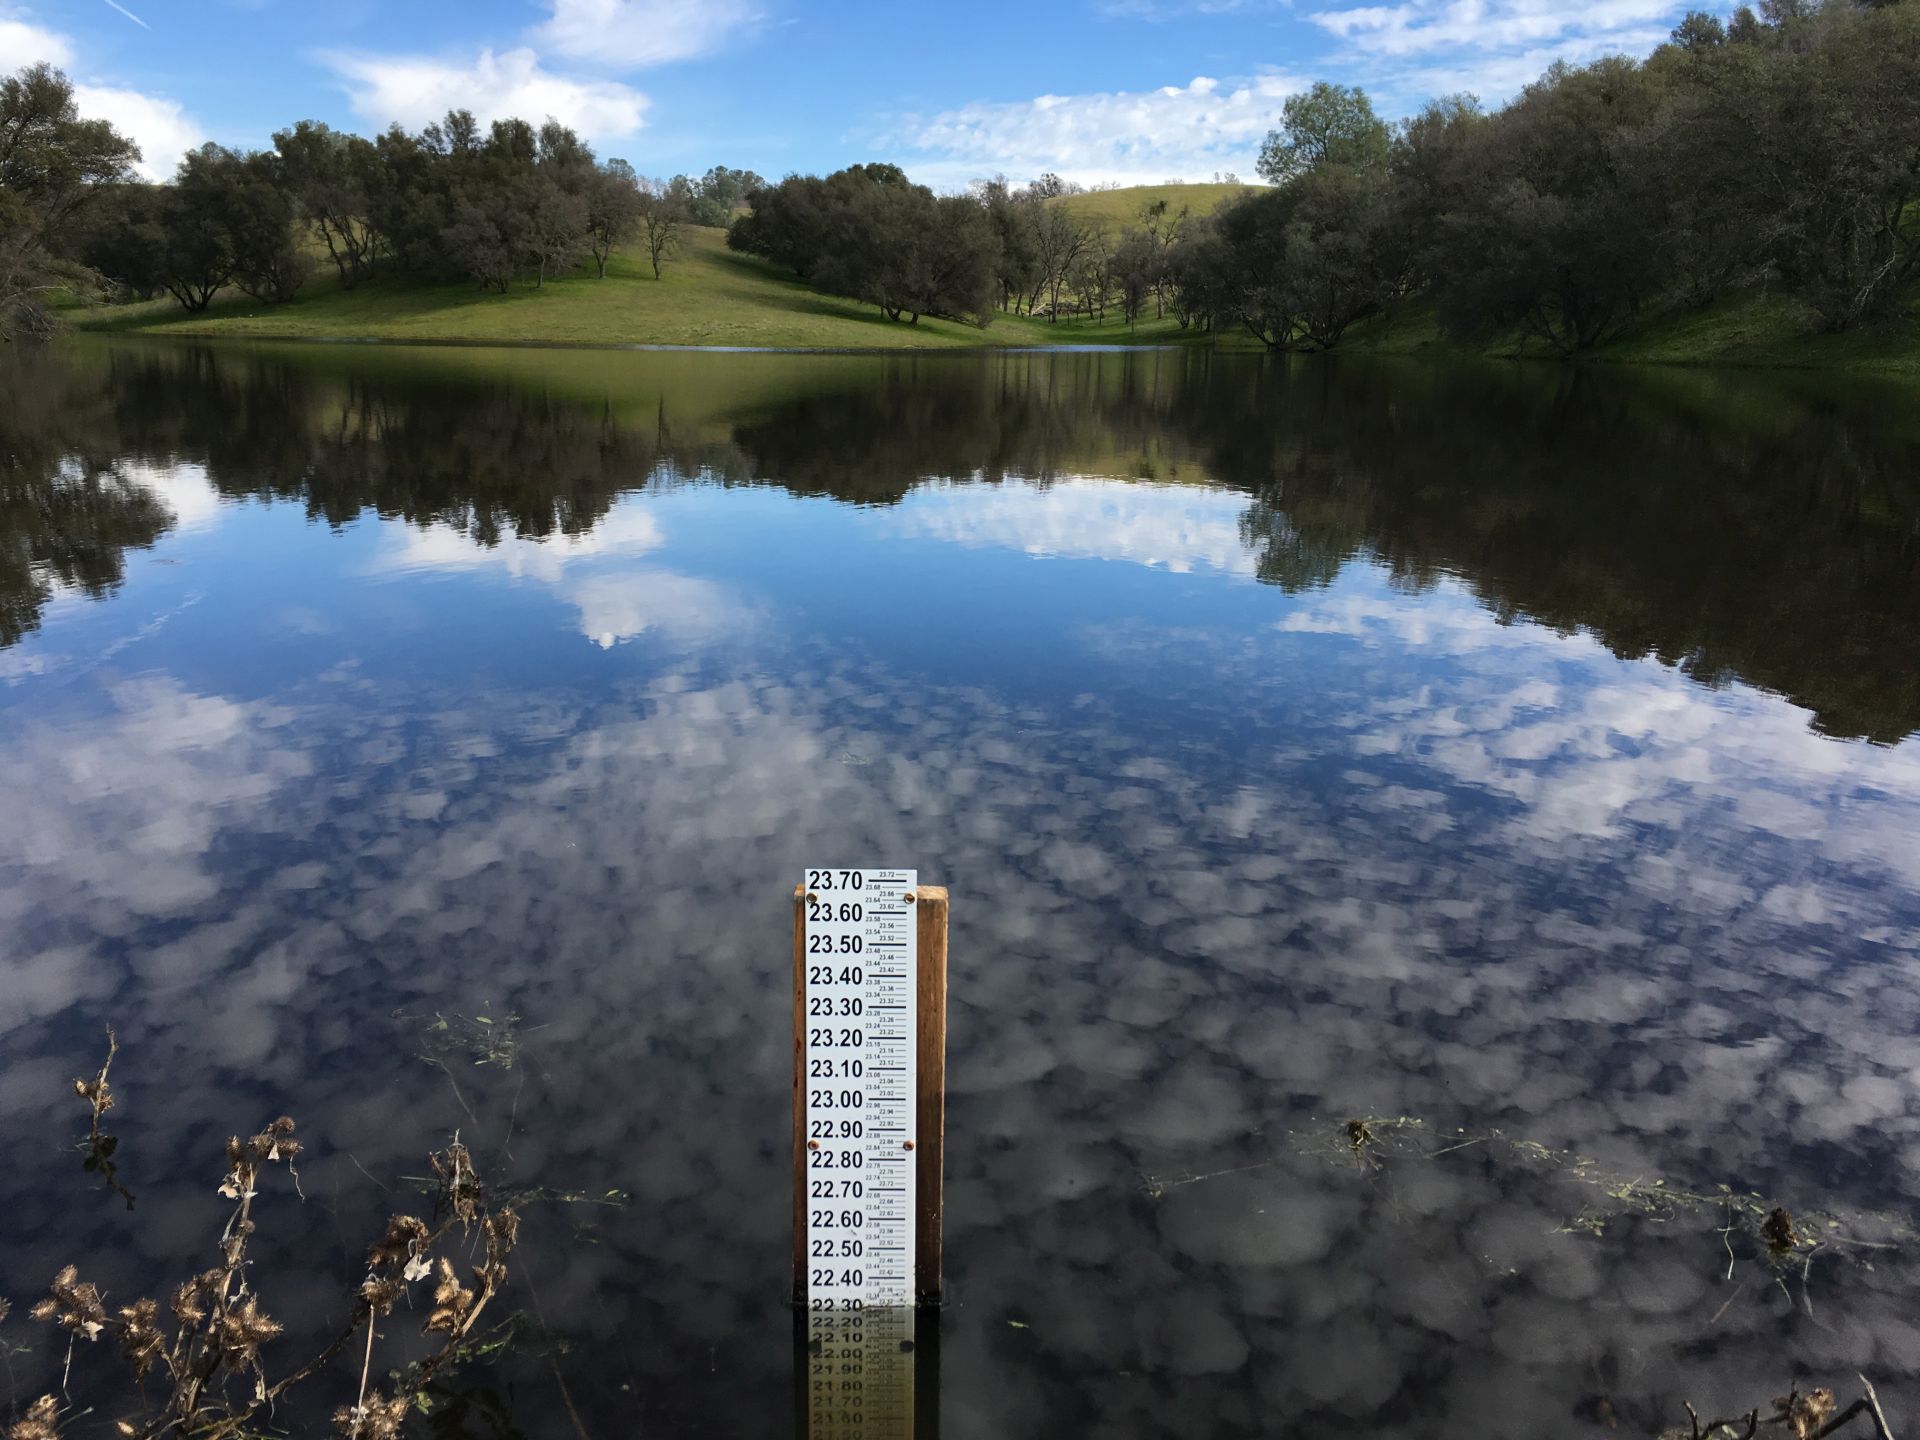
20170131VR_Pond.jpg ( 2017-01-31 11:25:44 ) Full size: 1920x1440
Nice reflection and gauge
9 sets found
16 VR_met graphs found
2 VR_flux graphs found
6 VR_soilco2 graphs found
2 VR_pond graphs found
Can't check TZVR_mixed
No data found for VR_fd.
No data found for VR_processed.
No data found for VR_arable.
No data found for VR_soilvue.