
Field Notes
<--2017-01-31 10:30:00 | 2017-03-16 09:00:00-->Other sites visited today: Tonzi | Tonzi
Phenocam link: Searching...
Vaira: 2017-03-02 13:00:00 (DOY 61)
Author: Joe Verfaillie
Others: Siyan
Summary: Standard field work, went to the pond, met cow rancher
| Vaira 2017-03-02 I arrived about 1pm with Siyan. It was sunny and warm. The surface has dried a bit but the pond is still spilling and the water hole is full. Grass seems happy, no trees on the trees. A rancher with a trailer full of cows came in the gate with us. We did the standard data collection at the tower. All seems well. I reset the guy wire anchor on the tower that has been loose for a couple of years. We went to the pond. The road surface was dry enough to drive all the way there. Coming back though, the cut just before the pond was too muddy to turn around in. I drove across the dam and turned around on the hill north of the pond. The pond was at 22.26ft. I pounded in a couple of stakes at the spillway and marked the water height on them to map the spillway contours another time. |
Field Data
No tank data
Well Depth
| Date | Location | Depth (feet) |
|---|---|---|
| 2017-03-02 | TZ_floor | 14.3 |
| 2017-03-02 | TZ_road | 27.1 |
| 2017-03-02 | TZ_tower | 16.8 |
| 2017-03-02 | VR_pond | 22.26 |
mode = both
Moisture Point Probes TZ
Array
(
[0] => Tower_1
[1] => Floor_South_1
[2] => Floor_East_1
[3] => Floor_West_1
[4] => Soil_Transect_4_1
[5] => Soil_Transect_3_1
[6] => Soil_Transect_2_1
[7] => Soil_Transect_1_1
[8] => SoilCO2_West_A_1
[9] => SoilCO2_West_B_1
[10] => SoilCO2_West_C_1
[11] => Tower_2
[12] => Floor_South_2
[13] => Floor_East_2
[14] => Floor_West_2
[15] => Soil_Transect_4_2
[16] => Soil_Transect_3_2
[17] => Soil_Transect_2_2
[18] => Soil_Transect_1_2
[19] => SoilCO2_West_A_2
[20] => SoilCO2_West_B_2
[21] => SoilCO2_West_C_2
[22] => Tower_3
[23] => Floor_South_3
[24] => Floor_East_3
[25] => Floor_West_3
[26] => Soil_Transect_4_3
[27] => Soil_Transect_3_3
[28] => Soil_Transect_2_3
[29] => Soil_Transect_1_3
[30] => SoilCO2_West_A_3
[31] => SoilCO2_West_B_3
[32] => SoilCO2_West_C_3
[33] => Tower_4
[34] => Floor_South_4
[35] => Floor_East_4
[36] => Floor_West_4
[37] => Soil_Transect_4_4
[38] => Soil_Transect_3_4
[39] => Soil_Transect_2_4
[40] => Soil_Transect_1_4
[41] => SoilCO2_West_A_4
[42] => SoilCO2_West_B_4
[43] => SoilCO2_West_C_4
)
| Date | DOY | Rep | Depth | Tower_1 |
Floor_South_1 |
Floor_East_1 |
Floor_West_1 |
Soil_Transect_4_1 |
Soil_Transect_3_1 |
Soil_Transect_2_1 |
Soil_Transect_1_1 |
SoilCO2_West_A_1 |
SoilCO2_West_B_1 |
SoilCO2_West_C_1 |
Tower_2 |
Floor_South_2 |
Floor_East_2 |
Floor_West_2 |
Soil_Transect_4_2 |
Soil_Transect_3_2 |
Soil_Transect_2_2 |
Soil_Transect_1_2 |
SoilCO2_West_A_2 |
SoilCO2_West_B_2 |
SoilCO2_West_C_2 |
Tower_3 |
Floor_South_3 |
Floor_East_3 |
Floor_West_3 |
Soil_Transect_4_3 |
Soil_Transect_3_3 |
Soil_Transect_2_3 |
Soil_Transect_1_3 |
SoilCO2_West_A_3 |
SoilCO2_West_B_3 |
SoilCO2_West_C_3 |
Tower_4 |
Floor_South_4 |
Floor_East_4 |
Floor_West_4 |
Soil_Transect_4_4 |
Soil_Transect_3_4 |
Soil_Transect_2_4 |
Soil_Transect_1_4 |
SoilCO2_West_A_4 |
SoilCO2_West_B_4 |
SoilCO2_West_C_4 |
Avg | Spacial Count |
Measurement Count |
|---|---|---|---|---|---|---|---|---|---|---|---|---|---|---|---|---|---|---|---|---|---|---|---|---|---|---|---|---|---|---|---|---|---|---|---|---|---|---|---|---|---|---|---|---|---|---|---|---|---|---|
| 2017-03-02 | 61 | 0 | nan | 39.3 | 27.6 | 39.9 | 38.2 | 36.1 | 21.4 | 28.5 | 36.4 | 35.2 | 34.9 | 35.5 | 41.7 | 43.6 | 38.4 | 40.8 | 33.5 | 32.6 | 32.3 | 25.2 | 31.3 | 25.8 | 32.6 | 38.6 | 43.5 | 39.6 | 42.4 | 36.3 | 32.4 | 37.7 | 35.7 | 36.6 | 39.1 | 39.9 | 40 | 56.6 | 41.4 | 45.1 | 35.1 | 45.4 | 48.3 | 37.7 | 45.4 | 51.4 | 48.6 | |||
| 2017-03-02 | 61 | 1 | nan | 38.4 | 24.7 | 39.9 | 38.2 | 35.2 | 21.4 | 27.6 | 35.8 | 36.1 | 34.3 | 36.4 | 42.3 | 43.9 | 39.9 | 41.4 | 32.3 | 31.9 | 32.3 | 24.9 | 31.6 | 25.9 | 33.2 | 38.5 | 42.7 | 39.6 | 43.3 | 36.6 | 32.7 | 36.6 | 36.3 | 36.6 | 39.4 | 39.4 | 38.8 | 56.3 | 41.4 | 45.4 | 35.7 | 45.7 | 49.4 | 36.2 | 45 | 51.1 | 49.1 | |||
| 2017-03-02 | 61 | Avg | 0-15cm | 0 | 0 | |||||||||||||||||||||||||||||||||||||||||||||
| 2017-03-02 | 61 | Avg | 15-30cm | 0 | 0 | |||||||||||||||||||||||||||||||||||||||||||||
| 2017-03-02 | 61 | Avg | 30-45cm | 0 | 0 | |||||||||||||||||||||||||||||||||||||||||||||
| 2017-03-02 | 61 | Avg | 45-60cm | 0 | 0 |
mode = both
Moisture Point Probes VR
Array
(
[0] => Solar_Panels_1
[1] => Flux_Tower_1
[2] => Gate_1
[3] => Biomass_Cage_1
[4] => Solar_Panels_2
[5] => Flux_Tower_2
[6] => Gate_2
[7] => Biomass_Cage_2
[8] => Solar_Panels_3
[9] => Flux_Tower_3
[10] => Gate_3
[11] => Biomass_Cage_3
[12] => Solar_Panels_4
[13] => Flux_Tower_4
[14] => Gate_4
[15] => Biomass_Cage_4
)
| Date | DOY | Rep | Depth | Solar_Panels_1 |
Flux_Tower_1 |
Gate_1 |
Biomass_Cage_1 |
Solar_Panels_2 |
Flux_Tower_2 |
Gate_2 |
Biomass_Cage_2 |
Solar_Panels_3 |
Flux_Tower_3 |
Gate_3 |
Biomass_Cage_3 |
Solar_Panels_4 |
Flux_Tower_4 |
Gate_4 |
Biomass_Cage_4 |
Avg | Spacial Count |
Measurement Count |
|---|---|---|---|---|---|---|---|---|---|---|---|---|---|---|---|---|---|---|---|---|---|---|
| 2017-03-02 | 61 | 0 | nan | 30.2 | 21.2 | 31.4 | 9.7 | 29.5 | 34.4 | 19.1 | 21.6 | 36.8 | 24.8 | 24.6 | 32.1 | 38.2 | 19.1 | 21.6 | 32.6 | |||
| 2017-03-02 | 61 | 1 | nan | 29.7 | 31.1 | 9.1 | 29.8 | 32.4 | 19.4 | 21.3 | 36.8 | 23.9 | 24 | 31.3 | 38.5 | 20.8 | 21.9 | 33.7 | ||||
| 2017-03-02 | 61 | Avg | 0-15cm | 0 | 0 | |||||||||||||||||
| 2017-03-02 | 61 | Avg | 15-30cm | 0 | 0 | |||||||||||||||||
| 2017-03-02 | 61 | Avg | 30-45cm | 0 | 0 | |||||||||||||||||
| 2017-03-02 | 61 | Avg | 45-60cm | 0 | 0 |
No TZ grass heigth found
No VR grass heigth found
No VR Tree DBH found
No water potential data found
No VR Grass Biomass data found
No VR OakLeaves Biomass data found
No VR PineNeedles Biomass data found
2 photos found
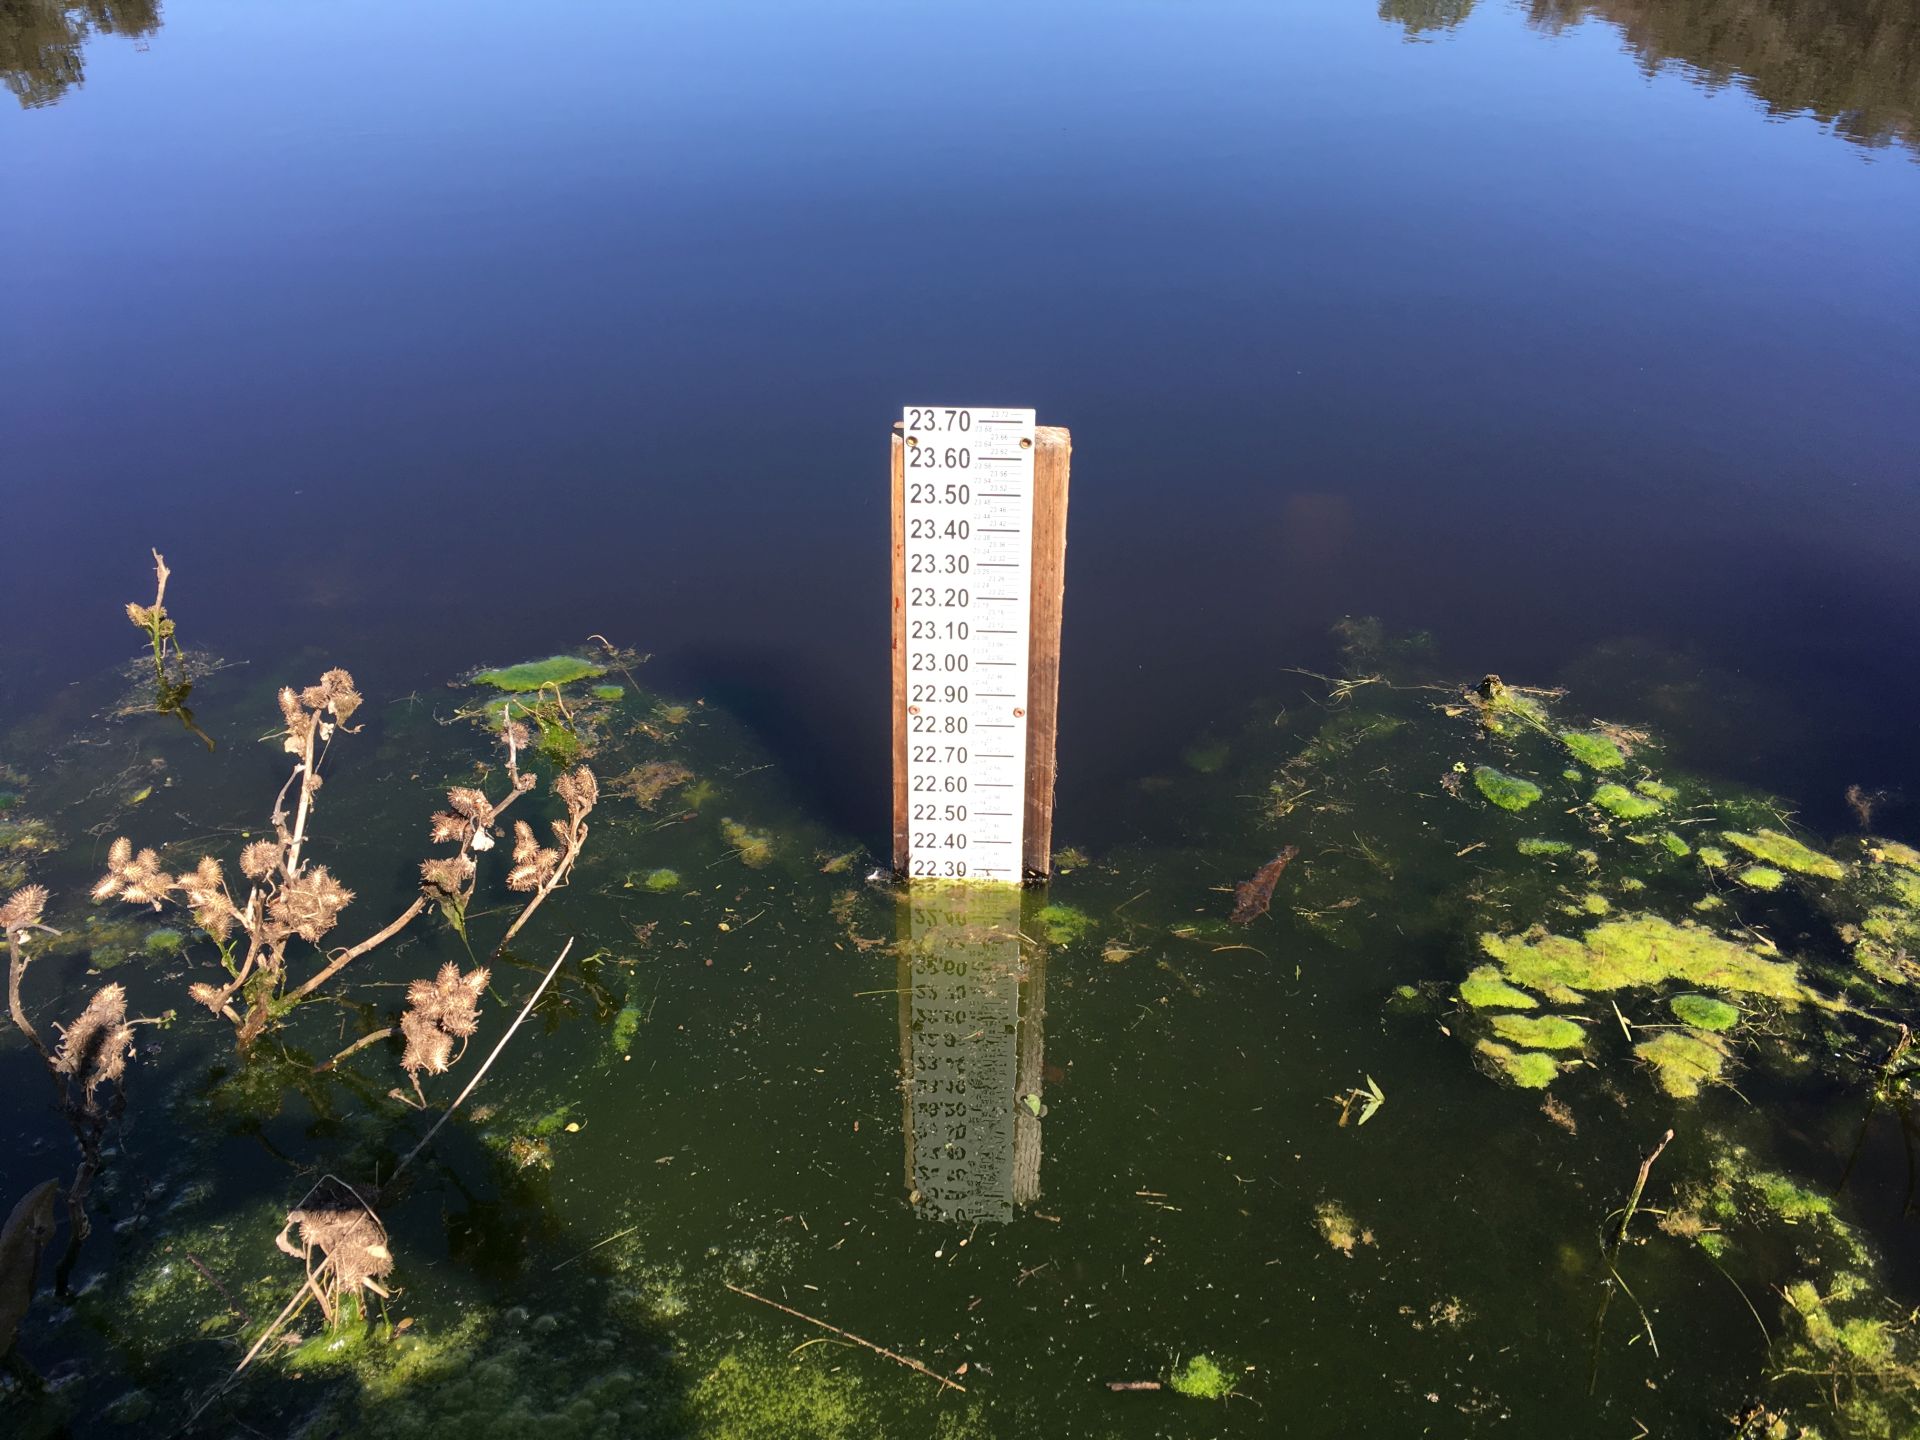
20170302VR_PondGauge.jpg ( 2017-03-02 13:39:23 ) Full size: 1920x1440
Vaira pond gauge
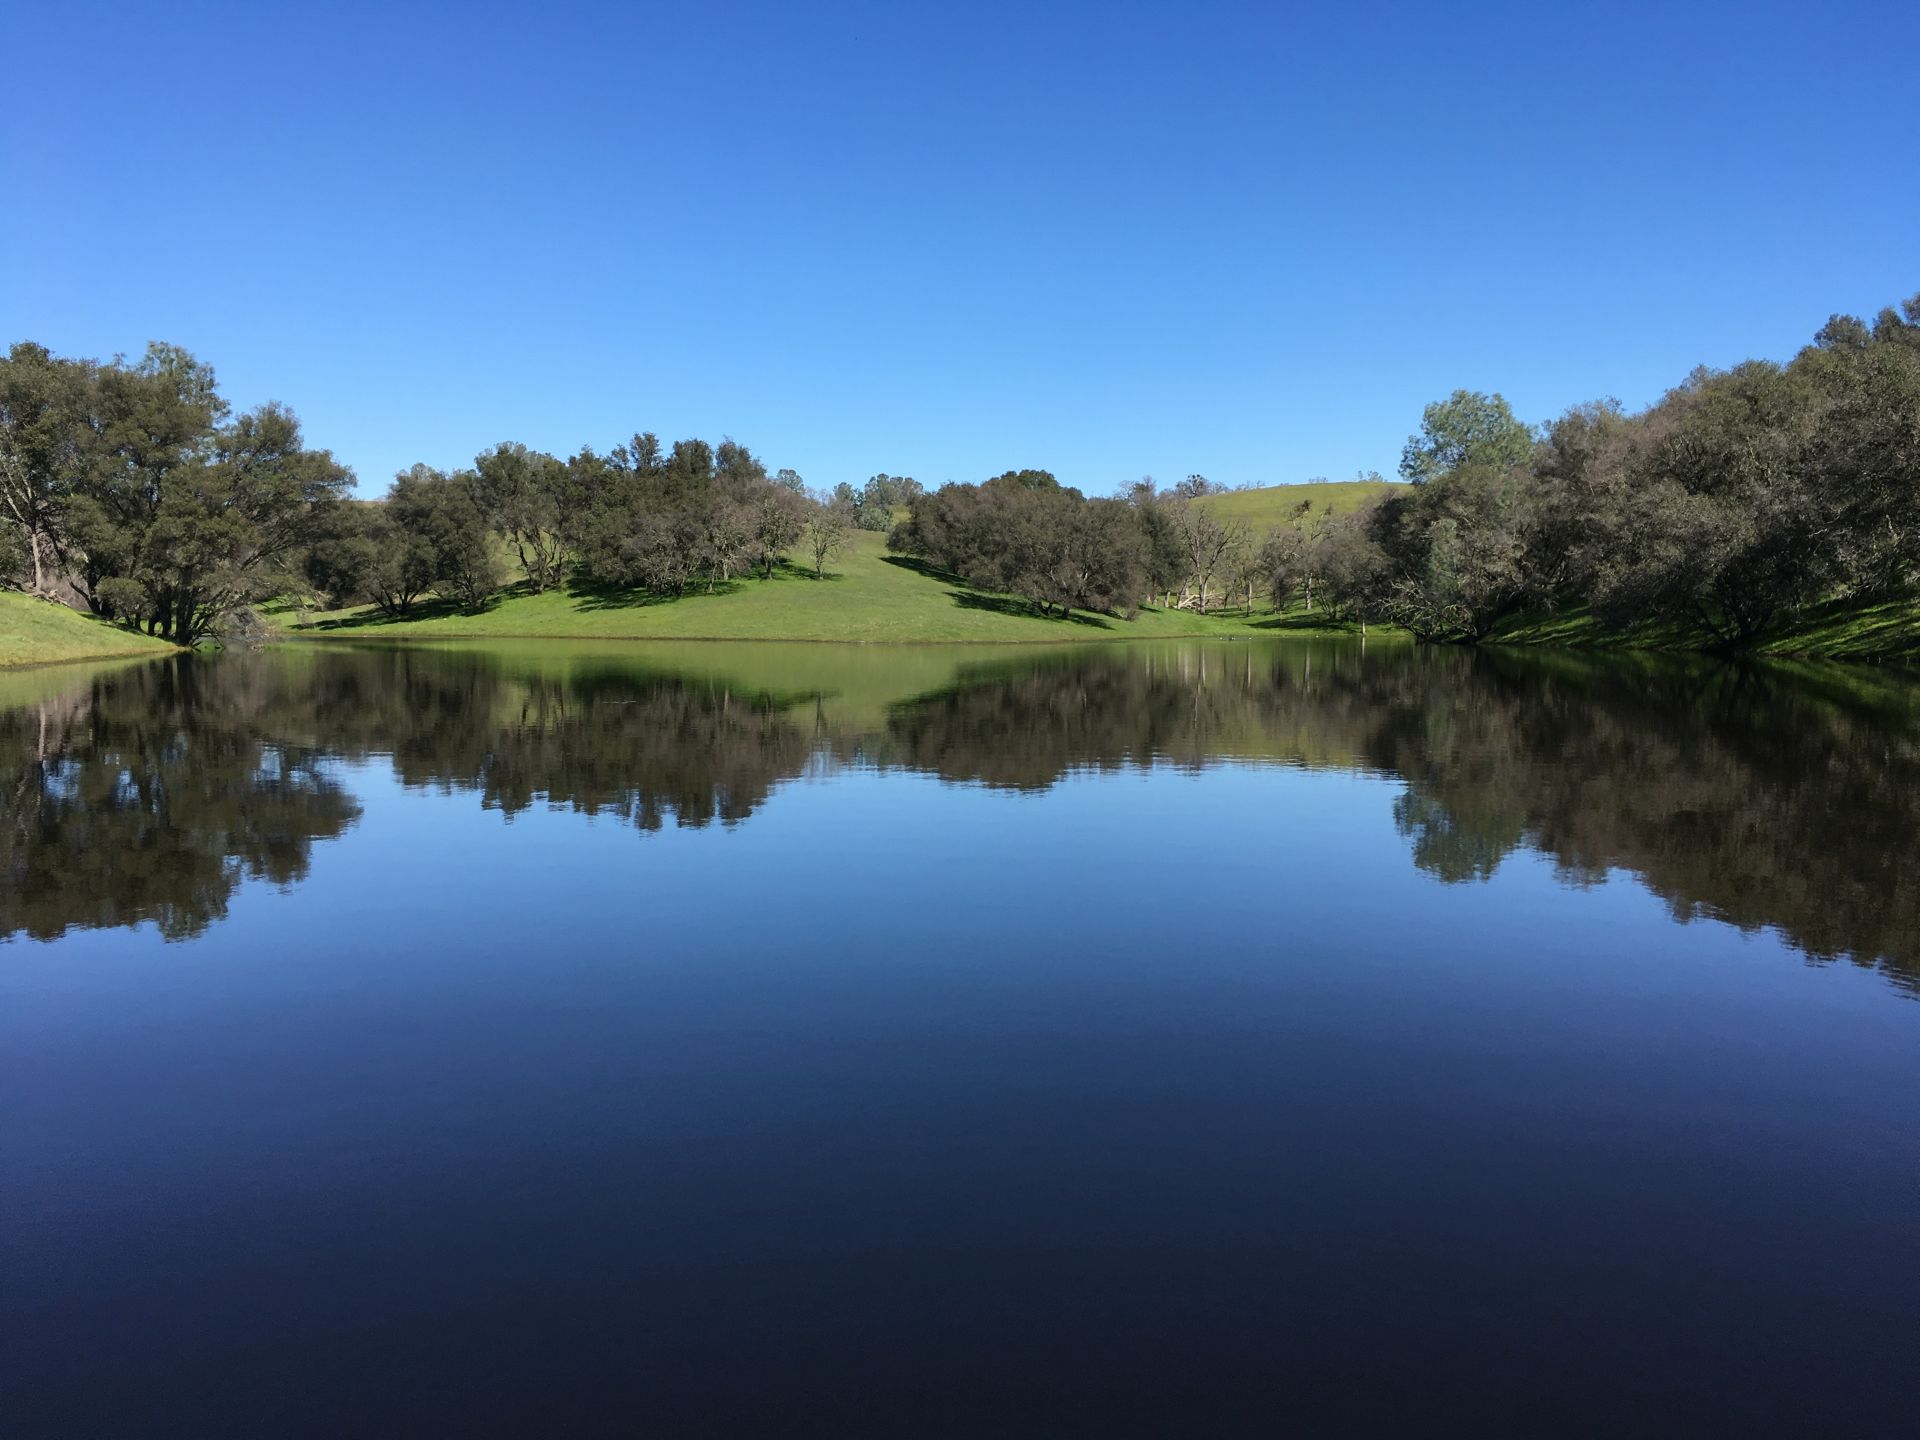
20170302VR_Pond.jpg ( 2017-03-02 13:39:32 ) Full size: 1920x1440
Nice reflections on Vaira Pond
9 sets found
16 VR_met graphs found
2 VR_flux graphs found
6 VR_soilco2 graphs found
2 VR_pond graphs found
Can't check TZVR_mixed
No data found for VR_fd.
No data found for VR_processed.
No data found for VR_arable.
No data found for VR_soilvue.