Field Notes
<--2017-01-17 13:50:00 | 2017-02-01 01:15:00-->Other sites visited today: Vaira | Tonzi | Sherman Wetland | Mayberry | West Pond | East End | Twitchell Rice
Phenocam link: Searching...
Twitchell Alfalfa: 2017-01-31 09:20:00 (DOY 31)
Author: Elke Eichelmann
Others: Sam Chamberlain
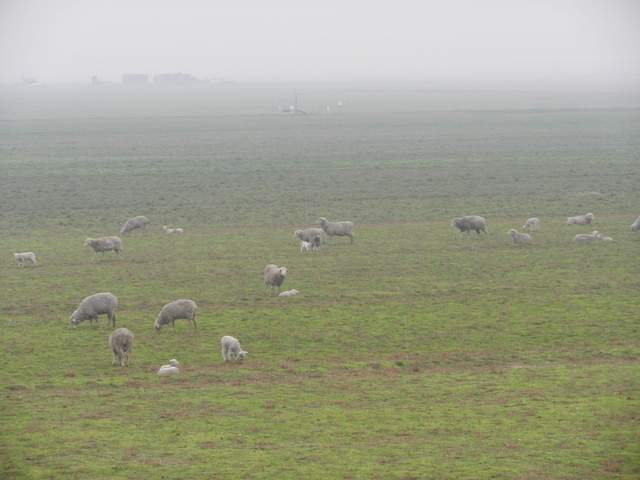
Summary: Sheep in the field, dense fog, no data lost, regular data collection
| Arrived at 9:20. It was cold and very foggy, visibility was down to only about 30m. There were sheep at the west end of the alfalfa field (west of the tower). I am not sure what they are eating, though. The alfalfa has not really grown back, but there was some grass growing on the field. We did soil respiration measurements. The LI6400 still shows a high humidity warning but the numbers seemed reasonable. The desiccant should probably be changed soon. The soil respiration measurements also took a long time to complete, probably because of the low fluxes at these cool temperatures. Collected USB GHG data, collected met data from CR1000, collected soilCO2 data, swapped camera card. All data looks good. It seems like there were no power outages and no data was lost since the last visit. The LI7500 CO2 reading was very high and the H2O was very low when we first connected but there was water on the window from the fog. After cleaning and drying the window the readings stabilized at more normal numbers. We also cleaned the radiation sensors. LI7500 readings: CO2 741.02 → 483.5 H2O 142.3 → 364.6 T 3.65 P 102.20 SS 63.77 → 102.25 Left at 10:10 |
1 photos found

20170201TA_Sheep.jpg ( 2017-02-01 14:27:14 ) Full size: 1920x1440
Sheep on a foggy alfalfa field
7 sets found
Can't check TA_met
11 TA_met graphs found
Can't check TA_rad
3 TA_rad graphs found
Can't check TA_flux
5 TA_flux graphs found
Can't check TA_soilco2
7 TA_soilco2 graphs found
No data found for TA_arable.
1 TA_cam graphs found
Can't check TATWBABCSB_cam

