
Field Notes
<--2014-06-11 05:00:00 | 2014-06-25 04:40:00-->Other sites visited today: Tonzi | Vaira
Phenocam link: Searching...
Tonzi: 2014-06-25 04:30:00 (DOY 176)
Author: Joe Verfaillie
Others: Siyan
Summary: Predawn water potential, fixed CO2 profile calibration solenoids and dirty cell, fixed Tram bad wheel, mapped trees, checked tower sonic settings
| Tonzi 2014-06-25 I arrived at about 4:30am with Siyan. The trees still look good, but the grass is completely dead. The ground is hard and dry. I met Mr. Tonzi’s grandson about 5:15am. His comment was it’s like a desert out there. Siyan said the well levels dropped by 3 to 6 feet from two weeks ago. Siyan did predawn water potential. I worked on the CO2 profile system. The solenoids that control the cal gases were chattering when I got there and the N2 tank was empty. I finally decided that there was a ground problem the let the relay control signal from the data logger to float around the activation voltage of the relays. The CR10X is on an isolating power supply half way up the tower. So the data logger ground may not be the same as the tower’s power system ground. I ran a jumper from the data logger ground to the tower power ground and this seemed to improve the situation. The whole power distribution system on the tower could be overhauled. The LI820 was dirty again. I cleaned its path and it ran much better but was not calibrated well. With the N2 tank being empty I did not have a zero, but then I remembered a tank of 2% ch4 in air that was used for water potential had little to no CO2. That tank uses a 590 fitting instead on the 580 on the N2 tank. So I had to swap the regulator of the CO2 span tank, but it worked. Zero was off by about 130ppm and span was off -137ppm. Last cal was 2014-05-22. On the manual tab the coefficients were 0.9547, 1.9421 and 6.7374e-10 after calibration. We went to Vaira about 8:30am The tram was not running again. I was derailed. The cotter pin in its south wheel had falled out. I replaced it with some wire and I reset it but it derailed again. Just before leaving I reset it and watched it run. It seemed the drive wheels were a little narrow for the track. I was able to add a washer to the south wheel and I think it will fix the problem. I walked around the tower area and matched the trees to Martin’s Lidar map. They matched very well. The software for the Global Water pressure sensor was not reinstalled correctly on the netbook when it was rebuilt. Seems its missing a USB to serial driver. I checked the sonic settings on the tower, but could not talk to the floor sonic. Tower sonic settings: B3 – 9600 baud E1 – Full duplex F1 – 8 bits, no parity G1 – measurement average off J2 – Two differential channels J5 – No SE channels L1 - M7 – UVW continuous binary NA – id A O1 – ASCII format comma separated P6 – 10 samples per second U1 – m/s Z1 - unknown X1 – Align U to Axis This seems to indicate that the U axis is aligned with the transducer head and not the north spar. This could introduce a 30 degree offset to wind directions. |
Field Data
No tank data
Well Depth
| Date | Location | Depth (feet) |
|---|---|---|
| 2014-06-25 | TZ_floor | 30.6 |
| 2014-06-25 | TZ_road | 39 |
| 2014-06-25 | TZ_tower | 41.4 |
mode = both
Moisture Point Probes TZ
Array
(
[0] => Tower_1
[1] => Floor_South_1
[2] => Floor_East_1
[3] => Floor_West_1
[4] => SoilCO2_1
[5] => Soil_Transect_4_1
[6] => Soil_Transect_3_1
[7] => Soil_Transect_1_1
[8] => SoilCO2_West_A_1
[9] => SoilCO2_West_B_1
[10] => Tower_2
[11] => Floor_South_2
[12] => Floor_East_2
[13] => Floor_West_2
[14] => SoilCO2_2
[15] => Soil_Transect_4_2
[16] => Soil_Transect_3_2
[17] => Soil_Transect_2_2
[18] => Soil_Transect_1_2
[19] => SoilCO2_West_A_2
[20] => SoilCO2_West_B_2
[21] => SoilCO2_West_C_2
[22] => Tower_3
[23] => Floor_South_3
[24] => Floor_East_3
[25] => Floor_West_3
[26] => SoilCO2_3
[27] => Soil_Transect_4_3
[28] => Soil_Transect_3_3
[29] => Soil_Transect_2_3
[30] => Soil_Transect_1_3
[31] => SoilCO2_West_A_3
[32] => SoilCO2_West_B_3
[33] => Floor_South_4
[34] => Floor_East_4
[35] => Floor_West_4
[36] => SoilCO2_4
[37] => Soil_Transect_4_4
[38] => Soil_Transect_3_4
[39] => Soil_Transect_2_4
[40] => Soil_Transect_1_4
[41] => SoilCO2_West_A_4
[42] => SoilCO2_West_B_4
[43] => SoilCO2_West_C_4
[44] => SoilCO2_West_C_1
[45] => SoilCO2_West_C_3
)
| Date | DOY | Rep | Depth | Tower_1 |
Floor_South_1 |
Floor_East_1 |
Floor_West_1 |
SoilCO2_1 |
Soil_Transect_4_1 |
Soil_Transect_3_1 |
Soil_Transect_1_1 |
SoilCO2_West_A_1 |
SoilCO2_West_B_1 |
Tower_2 |
Floor_South_2 |
Floor_East_2 |
Floor_West_2 |
SoilCO2_2 |
Soil_Transect_4_2 |
Soil_Transect_3_2 |
Soil_Transect_2_2 |
Soil_Transect_1_2 |
SoilCO2_West_A_2 |
SoilCO2_West_B_2 |
SoilCO2_West_C_2 |
Tower_3 |
Floor_South_3 |
Floor_East_3 |
Floor_West_3 |
SoilCO2_3 |
Soil_Transect_4_3 |
Soil_Transect_3_3 |
Soil_Transect_2_3 |
Soil_Transect_1_3 |
SoilCO2_West_A_3 |
SoilCO2_West_B_3 |
Floor_South_4 |
Floor_East_4 |
Floor_West_4 |
SoilCO2_4 |
Soil_Transect_4_4 |
Soil_Transect_3_4 |
Soil_Transect_2_4 |
Soil_Transect_1_4 |
SoilCO2_West_A_4 |
SoilCO2_West_B_4 |
SoilCO2_West_C_4 |
SoilCO2_West_C_1 |
SoilCO2_West_C_3 |
Avg | Spacial Count |
Measurement Count |
|---|---|---|---|---|---|---|---|---|---|---|---|---|---|---|---|---|---|---|---|---|---|---|---|---|---|---|---|---|---|---|---|---|---|---|---|---|---|---|---|---|---|---|---|---|---|---|---|---|---|---|---|---|
| 2014-06-25 | 176 | 0 | nan | 10.9 | 1.3 | 11.2 | 6.8 | 3.4 | 0.1 | 2 | 3.6 | 5.6 | 2.1 | 9.7 | 13.6 | 10.9 | 10 | 8.4 | 17 | 21 | 13.3 | 5.4 | 7.5 | 0.5 | 18.5 | 18.7 | 12.3 | 13.4 | 15.4 | 18.4 | 11.1 | 22.1 | -16.2 | 12.3 | 15.9 | 16.5 | 6.4 | 21.1 | 12.2 | 11.1 | 21.3 | 13.6 | 23.4 | 11 | 20.8 | 14.8 | 15.3 | |||||
| 2014-06-25 | 176 | 1 | nan | 9.1 | 1.2 | 2.4 | 1.2 | 2.5 | 1.8 | 9 | 13.6 | 10 | 8.7 | 10 | 21.9 | 13.3 | 4.8 | 17.6 | 18.4 | 11.7 | 15.1 | 18.7 | 10.3 | 23.2 | 15.4 | 12.9 | 7.9 | 15.6 | 11.1 | 11.3 | 14.8 | 22.8 | 10.7 | 15.6 | 21 | 30.8 | ||||||||||||||||
| 2014-06-25 | 176 | Avg | 0-15cm | 0 | 0 | |||||||||||||||||||||||||||||||||||||||||||||||
| 2014-06-25 | 176 | Avg | 15-30cm | 0 | 0 | |||||||||||||||||||||||||||||||||||||||||||||||
| 2014-06-25 | 176 | Avg | 30-45cm | 0 | 0 | |||||||||||||||||||||||||||||||||||||||||||||||
| 2014-06-25 | 176 | Avg | 45-60cm | 0 | 0 |
mode = both
Moisture Point Probes VR
Array
(
[0] => Solar_Panels_1
[1] => Flux_Tower_1
[2] => Gate_1
[3] => Biomass_Cage_1
[4] => Solar_Panels_2
[5] => Flux_Tower_2
[6] => Gate_2
[7] => Biomass_Cage_2
[8] => Solar_Panels_3
[9] => Flux_Tower_3
[10] => Gate_3
[11] => Biomass_Cage_3
[12] => Solar_Panels_4
[13] => Flux_Tower_4
[14] => Gate_4
[15] => Biomass_Cage_4
)
| Date | DOY | Rep | Depth | Solar_Panels_1 |
Flux_Tower_1 |
Gate_1 |
Biomass_Cage_1 |
Solar_Panels_2 |
Flux_Tower_2 |
Gate_2 |
Biomass_Cage_2 |
Solar_Panels_3 |
Flux_Tower_3 |
Gate_3 |
Biomass_Cage_3 |
Solar_Panels_4 |
Flux_Tower_4 |
Gate_4 |
Biomass_Cage_4 |
Avg | Spacial Count |
Measurement Count |
|---|---|---|---|---|---|---|---|---|---|---|---|---|---|---|---|---|---|---|---|---|---|---|
| 2014-06-25 | 176 | 0 | nan | 0.1 | 1.8 | 0.9 | 0.7 | 10 | 6.6 | 5.4 | 3.2 | 14.3 | 2 | 8.4 | 10.6 | 26.5 | 11.6 | 8.2 | 13.6 | |||
| 2014-06-25 | 176 | 1 | nan | 0.3 | 2.4 | 0.9 | 0.4 | 9 | 6.3 | 5.7 | 3.2 | 13.1 | 1.4 | 8.4 | 10.3 | 27.6 | 10.7 | 8.7 | 13 | |||
| 2014-06-25 | 176 | Avg | 0-15cm | 0 | 0 | |||||||||||||||||
| 2014-06-25 | 176 | Avg | 15-30cm | 0 | 0 | |||||||||||||||||
| 2014-06-25 | 176 | Avg | 30-45cm | 0 | 0 | |||||||||||||||||
| 2014-06-25 | 176 | Avg | 45-60cm | 0 | 0 |
No TZ grass heigth found
No VR grass heigth found
Tree DBH
| Date | Tag# | Reading (mm) |
|---|---|---|
| 2014-06-25 | 1 | 99 |
| 2014-06-25 | 1 | 7.4 |
| 2014-06-25 | 102 | 22.8 |
| 2014-06-25 | 102 | 4.4 |
| 2014-06-25 | 2 | 20.9 |
| 2014-06-25 | 2 | 10.3 |
| 2014-06-25 | 245 | 18.0 |
| 2014-06-25 | 3 | 23.3 |
| 2014-06-25 | 3 | 6.8 |
| 2014-06-25 | 4 | 99 |
| 2014-06-25 | 4 | 10.1 |
| 2014-06-25 | 5 | 26.1 |
| 2014-06-25 | 5 | 8.3 |
| 2014-06-25 | 7 | 21.8 |
| 2014-06-25 | 7 | 8.4 |
| 2014-06-25 | 72 | 18.2 |
| 2014-06-25 | 79 | 23.0 |
| 2014-06-25 | 79 | 10.9 |
| 2014-06-25 | 8 | 12.3 |
Water Potential - mode: raw
| Time | Species | Tree | readings (bar) | ||
|---|---|---|---|---|---|
| 2014-06-25 04:40:00 | OAK | 102 | -10 | -15 | -14 |
| 2014-06-25 04:40:00 | OAK | 35 | -15 | -21 | -19 |
| 2014-06-25 04:40:00 | OAK | 92 | -7 | -8 | -8.5 |
| 2014-06-25 05:01:00 | PINE | OLD | -10 | -15 | -18 |
| 2014-06-25 05:01:00 | PINE | YNG | -8 | -7 | -3 |
No TZ Grass Biomass data found
No TZ OakLeaves Biomass data found
No TZ PineNeedles Biomass data found
1 photos found
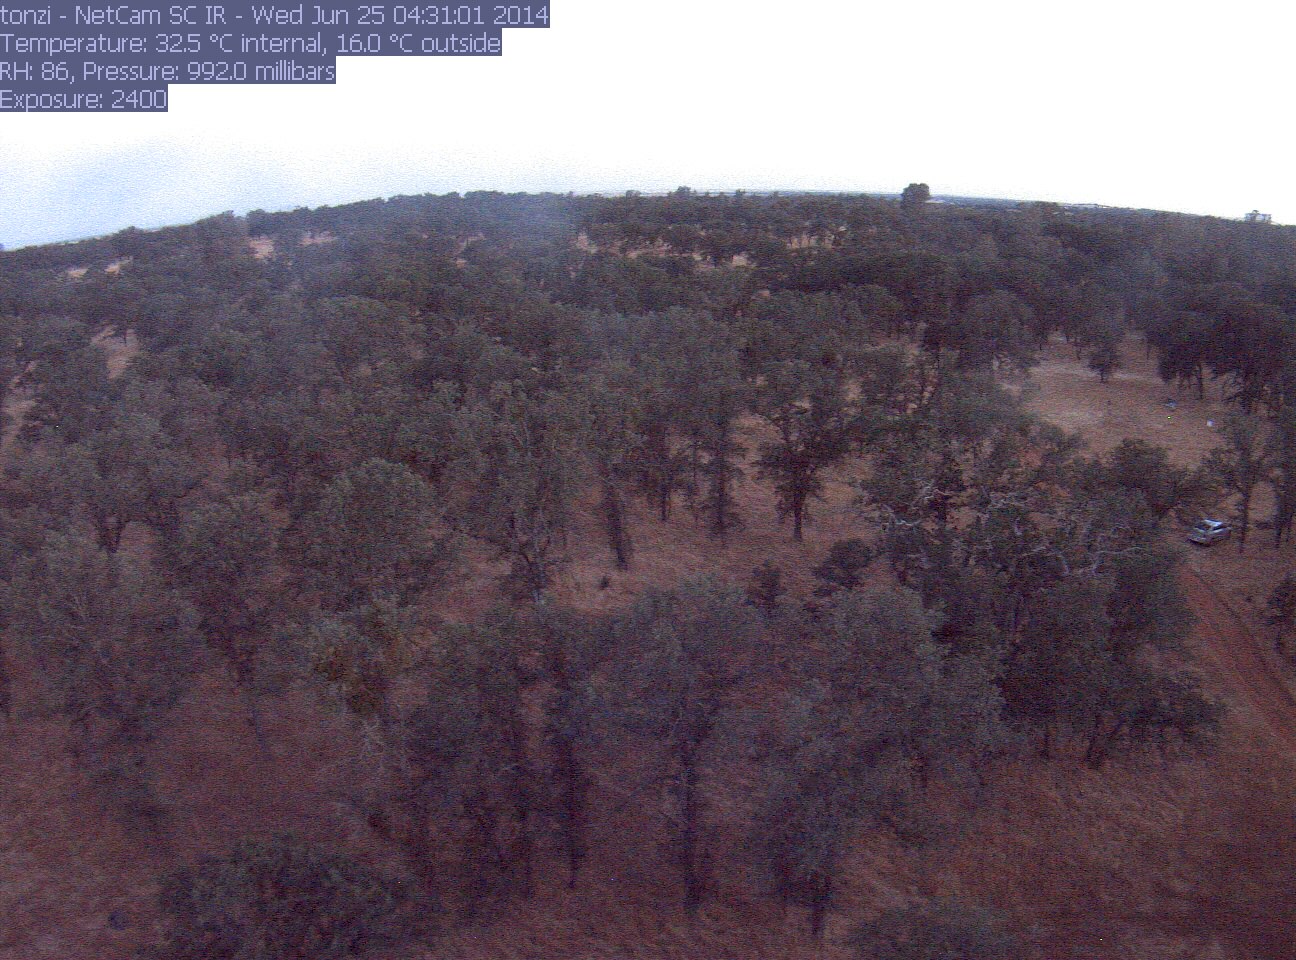
tonzi_2014_06_25_043101.jpg ( 2014-06-25 04:28:40 ) Full size: 1296x960
Predawn water potential
16 sets found
No data found for TZ_Fenergy.
11 TZ_tmet graphs found
11 TZ_soilco2 graphs found
Can't check TZ_mixed
3 TZ_mixed graphs found
1 TZ_fflux graphs found
8 TZ_fmet graphs found
1 TZ_tram graphs found
3 TZ_co2prof graphs found
No data found for TZ_irt.
No data found for TZ_windprof.
1 TZ_tflux graphs found
2 TZ_sm graphs found
Can't check TZ_met
1 TZ_met graphs found
Can't check TZVR_mixed
8 TZ_osu graphs found
No data found for TZ_fd.
Tonzi Z-cam data