Field Notes
<--2024-10-17 12:45:00 | 2024-11-06 08:53:00-->Other sites visited today: Mayberry | Bouldin Corn | Bouldin Alfalfa | East End
Phenocam link: Searching...
Gilbert Tract: 2024-10-23 09:05:00 (DOY 297)
Author: Daphne Szutu
Others: Kuno
Summary: Final Robert/Kuno chamber samples, removed Robert's 3 thermocouple profiles in the wetland, reinstalled ADCP and EXO in channel, swapped 7500 for calibration
| 2024-10-23 Gilbert Tract Kuno and I arrived at 9:05 PST. It was sunny, warm, and still—the air smelled smoky. I dropped Kuno off at the tower for the final chamber sampling (high tide). He also removed the equipment at the three thermocouple stations. Thermocouple profiles, a solar panel, and a lithium power pack were removed from each station, along with the following equipment: Northside station (NS) CR10X sn 13214 IRT sn 7385 miniDOT sn 899502 Southside station (SS) CR10X sn 3501 IRT sn 7638 Upland station (UL) CR10X sn 19481 IRT sn 1624 miniDOT sn 180871 I downloaded all of the data later in the lab. I started at the channel at 9:10 PST. The water level was pretty high so I was glad to have rubber boots on because it was hard to pull the ADCP mount all the way up to dry ground. I installed the ADCP sn SL2149007 back on its mounting plate in the same position (matching up the ADCP with the negative space not covered with light-colored, spongy biofouling). The ADCP cable was just repaired in the lab and Joe put the whole length in metal conduit. I only had 2 of the 3 stainless steel screws, so used one non-SS screw that we can swap out the next time we pull the railing up. I wasn’t able to connect at first until I redid the cable connector at the ADCP. I started data logging and confirmed the real-time data looked reasonable. I installed the EXO, fresh from calibration. I connected via Bluetooth and confirmed that the deployment was active. I also checked that the real-time data on the CR6 looked reasonable. Sensors installed: sn 23H107001 EXO3s sn 24F102410 Turbidity sn 22C100780 fDOM sn 24F100050 Conductivity/Temperature sn 24G102326 pH/ORP sn 24F104086 wiper I started the regular tower work at 10:30 PST as Kuno was finishing up. I downloaded met, cam, and USB GHG data. I downloaded miniDOT data and swapped its desiccant. I measured surface water conductivity and read the staff gauge at 72cm, although I didn’t write down the time…maybe 10:45 PST. Surface, 577us, 15.2C The Song Meter Micro battery was 14%. I swapped in freshly charged AA batteries and fresh desiccant. I topped off the reservoir. Kuno cleaned flux and rad sensors and we swapped the 7500 for calibration: sn 75H-2176 came off and sn 75H-2514 went on. I uploaded a new config file, updated the pressure coefficients, changed the eddy clock +2min to match the laptop clock, and reset the box. There was a larger than usual change in pressure (101.9 to 102.2kPa) after the swap. I confirmed that my A0 and A1 values were accurate. I confirmed the USB was logging and the 7700 was ok. old 75H-2176 read: 425pm CO2, 539mmol/m3 H2O, 21.8C, 101.9kPa, 100SS fresh 75H-2514 read: 428ppm CO2, 538mmol/m3 H2O, 22.9C, 102.2kPa, 98.6SS 7700 read: 2.1ppm CH4, 52RSSI – 83 after cleaning We left at 11:00 PST. |
2 photos found

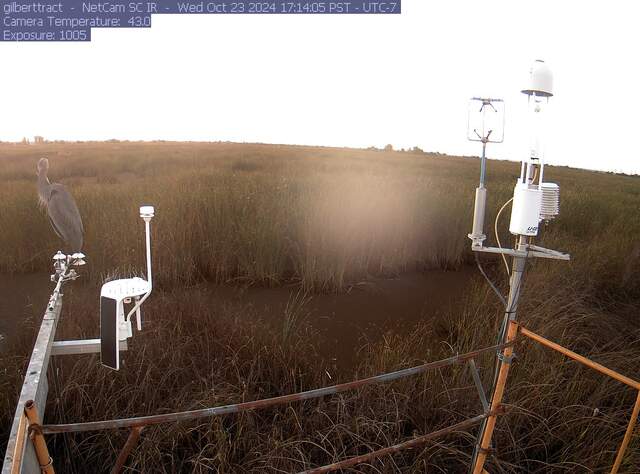
gilberttract_2024_10_23_171405.jpg ( 2024-10-24 01:15:54 ) Full size: 1296x960
Great blue heron on the radiometers

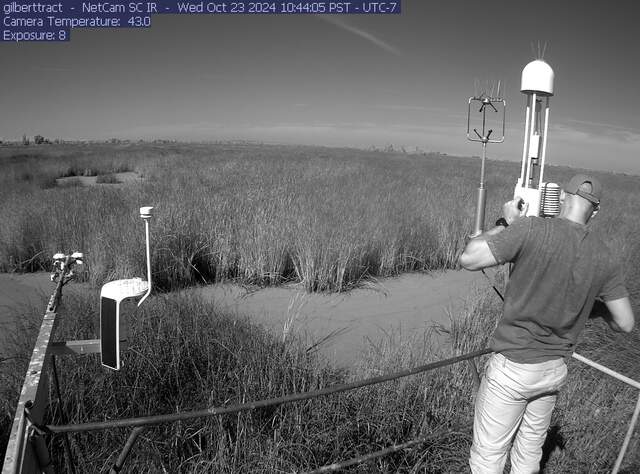
gilberttract_IR_2024_10_23_104405.jpg ( 2024-10-23 18:47:02 ) Full size: 1296x960
Kuno cleaning sensors in IR
8 sets found
Can't check MBWPEESWGT_mixed
Can't check MBEEWPSWEPGT_cam
16 GT_met graphs found
4 GT_flux graphs found
No data found for GT_adcp.
1 GT_cam graphs found
2 GT_usgs graphs found
2 GT_chanexo graphs found

