Field Notes
<--2014-02-25 10:40:00 | 2014-03-13 09:30:00-->Other sites visited today: East End | Twitchell Alfalfa | Twitchell Rice | West Pond | Mayberry
Phenocam link: Searching...
Sherman Island: 2014-03-07 15:15:00 (DOY 66)
Author: Cove Sturtevant
Others: Sara, Joe
Summary: Dropped off box for N2O test equipment. Reattached shadow band on diffuse PAR sensor. Reconstructed electric fence around power pole.
| Sherman 2014-03-07 We arrived close to 15:15 PST. There is still a nice green grass layer and the pepperweed seems to be growing pretty quickly. Quick visit to drop off the box to house the forerunner N2O test equipment. Did a quick check of the data but didn’t record readings. All ok. Only problem was that the shadow band fell off the diffuse PAR sensor. Reattached. The cows knocked down the electric fence around the power pole. Reconstructed fence with barbed wire instead of smooth. |
2 photos found

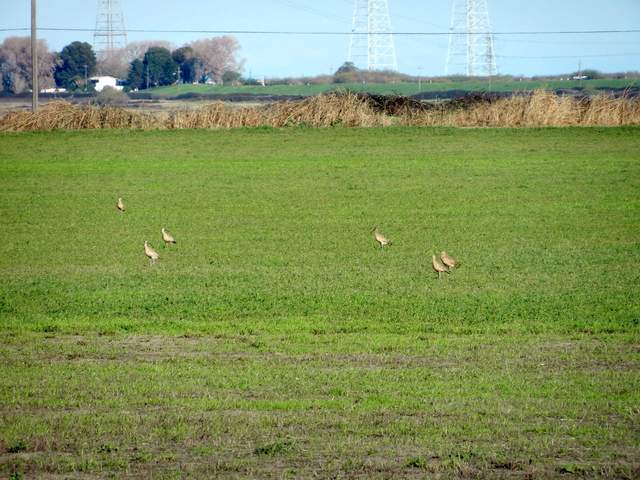
20140307SI_Ibis.jpg ( 2014-03-07 17:09:38 ) Full size: 1920x1440
Some Ibis in the cow pasture

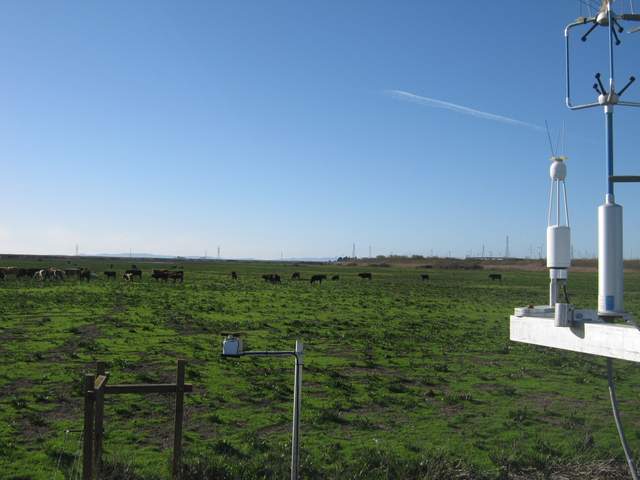
SI_autocam_20140307_1615.jpg ( 2014-03-07 16:15:02 ) Full size: 1920x1440
Shadow band replaced
7 sets found
No data found for SI_mp.
11 SI_met graphs found
Can't check SI_mixed
2 SI_mixed graphs found
4 SI_flx graphs found
3 SI_soilco2 graphs found
Can't check TWSI_mixed
Can't check SIMBTWEE_met

