
Field Notes
<--2014-02-25 16:30:00 | 2014-03-13 12:15:00-->Other sites visited today: Sherman Island | East End | Twitchell Alfalfa | West Pond | Mayberry
Phenocam link: Searching...
Twitchell Rice: 2014-03-07 11:15:00 (DOY 66)
Author: Cove Sturtevant
Others: Sara, Joe
Summary: Field flooded. Cattails growing in footprint. Swapped out 7500. Updated 7500A/7550 firmware. Updated 7700 firmware and calibrated. Unblocked rain gauge and moved it near boardwalk.
| Twitchell Rice
2014-03-07 We arrived about 11:15 PST. Partly cloudy, cool, and windy. The field has standing water and there is a large patch of cattails growing up ~10 meters to the WNW of the tower. We checked the readings, swapped the 7500 for a freshly calibrated one (removed sn 75H-2176, installed sn 75H-2182), updated the 7500A/7550 firmware (downloaded GHG data first), and calibrated the 7700 (sn TG1-0211). We tried to update the 7700 firmware but kept getting a network error. Joe came with us back to the site later and figured out that the computer and the 7700 have to be on the same local subnet. We were able to update the 7700 firmware at that time. 7500 readings: CO2 = 393 ppm (397 after cleaning, 398 after swap) H2O = 448 mmol m-3 (520 after cleaning, 433 after swap) signal strength = 89.0% (89.9% after cleaning, 81.8% after swap) sos = 344 m s-1 7700 readings: CH4 = 1.88 ppm variable (1.9 after cleaning and calibration) RSSI = 53% (73% after cleaning) Met looked good. When Joe came with us back to the site later he found that the rain gauge was blocked and full of water. He upblocked it (allowing the water to flow through), cleaned it, and moved it next to the boardwalk so it’s easier to check on. We may want to replace the precip readings over the last couple weeks with those recorded from the CIMIS station. |
2 photos found
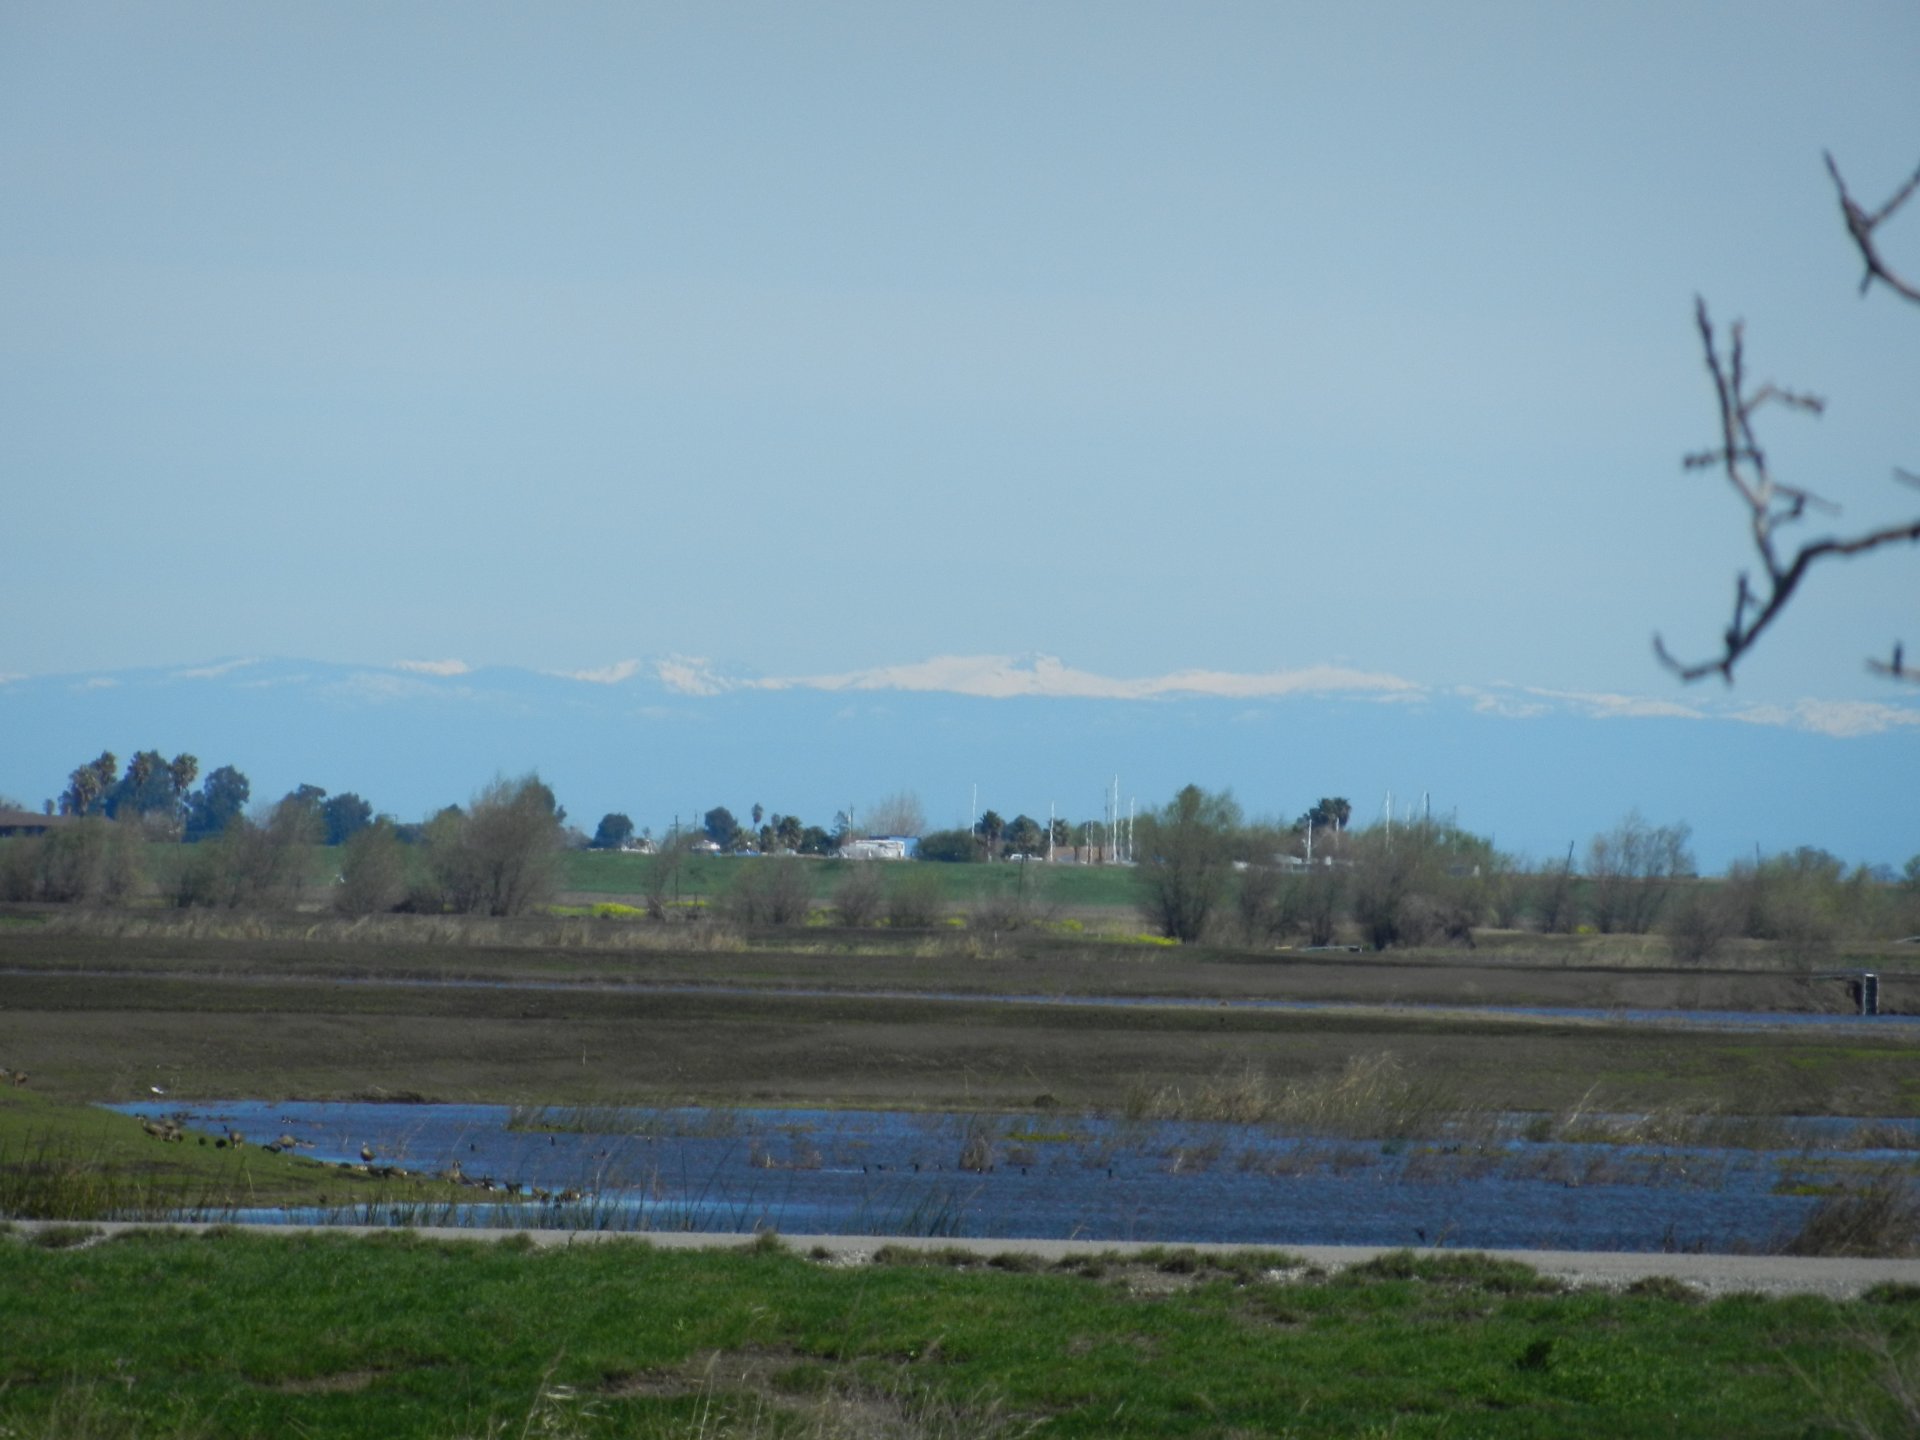
20140307TW_SierrasSnow2.jpg ( 2014-03-07 13:53:13 ) Full size: 1920x1440
Snow in the Sierras from Twitchell
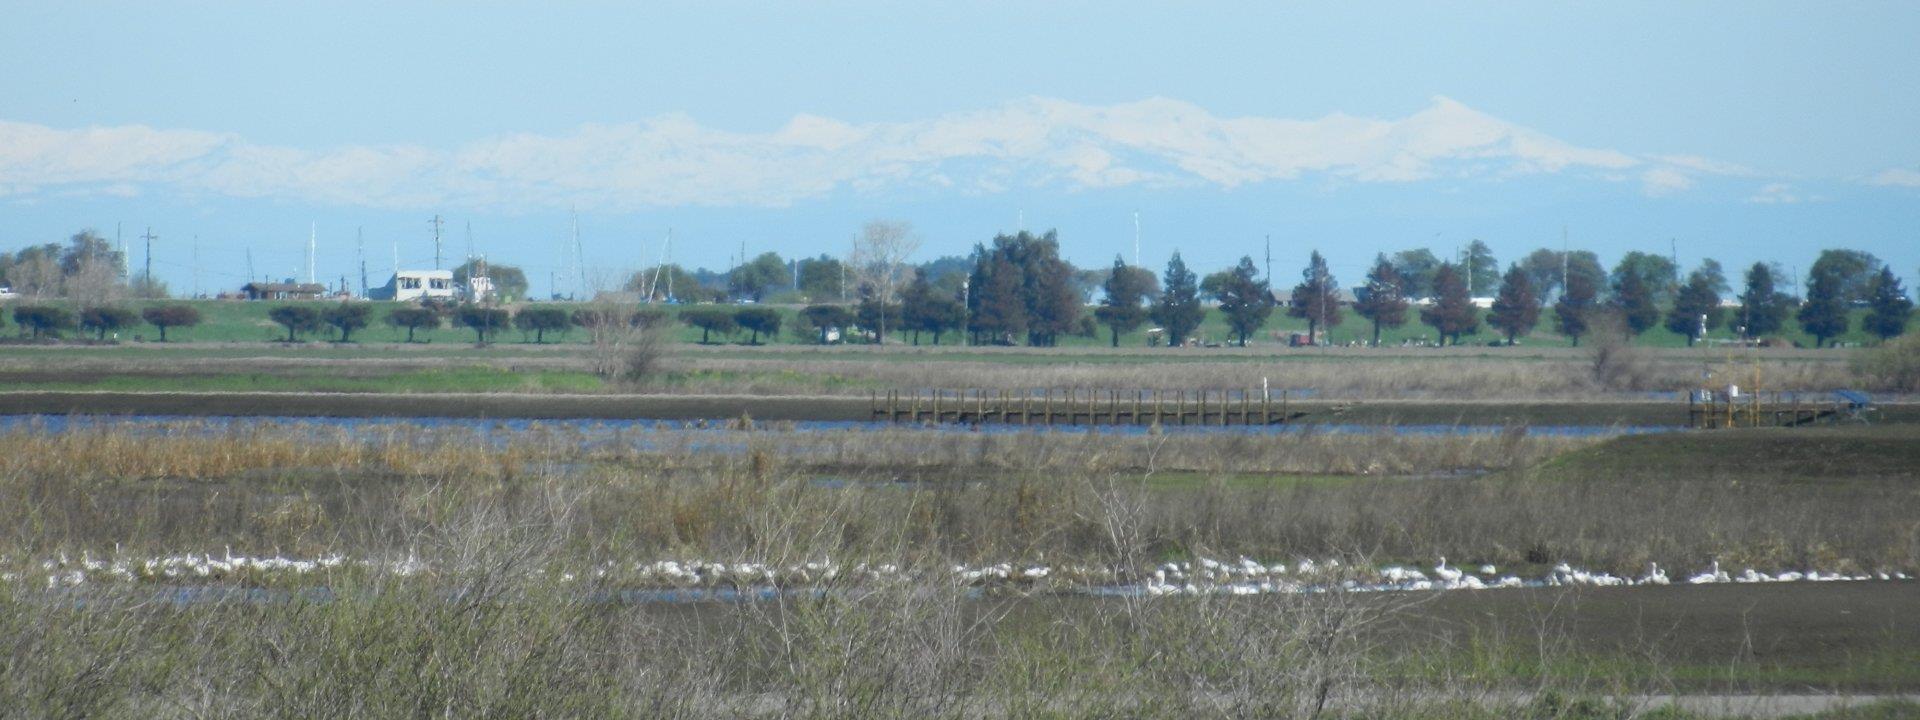
20140307TW_SierrasSnow1.jpg ( 2014-03-07 13:53:00 ) Full size: 1920x720
Snow in the Sierras from Twitchell
6 sets found
12 TW_met graphs found
5 TW_flux graphs found
Can't check TWSI_mixed
Can't check SIMBTWEE_met
No data found for TW_cam.
Can't check TATWBABCSB_cam