
Field Notes
<--2012-11-15 12:30:00 | 2012-12-06 13:10:00-->Other sites visited today: DWR Corn | West Pond | Twitchell Rice | Mayberry
Phenocam link: Searching...
Sherman Island: 2012-11-29 11:30:00 (DOY 334)
Author: Cove Sturtevant
Others: Joe, Sara
Summary: Water in ditch low, grass layer present. Regular field work and instrument cleaning. Installed new power stabilizer for soil CO2 system.
| Sherman
2012-11-29 Joe, Sara, and I arrived about 11:30 PST, later than usual since we went to the corn, etc. first to grab batteries from the portable tower truck (see below). It was a wee chilly, about 14 °C, with a good breeze and low clouds. The water level in the ditch by the field was low, with an exposed muddy bottom in some parts. Although the pepperweed is all dead and nearly completely eaten or trampled by the cows (which really liked Sara’s read jacket), the recent rains have livened up and expanded the short grass layer. Sara did soil respiration, well depth, moisture point, and spectral. I checked the tower, downloaded the data, and cleaned the instruments (including radiation sensors). Joe added in a power stabilizer for the soil CO2 system. He hypothesized that the system was cutting out due to too large a draw on the current power supply. He installed the solar controller and battery pack from the portable tower into the 24V system. It worked! Way to go Joe. A note about the recent data from the soilCO2 system. There were no daily files after day 320. This may be a product of the system cutting out and not recording at all, or the data may simply have not been parsed out. We downloaded all the soil co2 data directly from the CR10x, so if it’s there, it’s in the file named for today. LGR readings: 10:23, 23.14 °C, 121.8 Torr (adjusted to 145.7 Torr), 13.83 us, 10 Hz, 2.1 ppm 7500 readings: CO2: 17.03 mmol m-3 H2O: 600 mmol m-3 diag: 248 MET looked good. I also synced the datalogger clocks, which were only a couple minutes slow. |
5 photos found

20121129SI_Cows.jpg ( 2012-11-29 12:29:02 ) Full size: 1920x1440
Herd of cows

20121129SI_SaraAvoidsCows.jpg ( 2012-11-29 12:28:46 ) Full size: 1920x1440
Herd of cows in front of Mt Diablo under cloudy skies
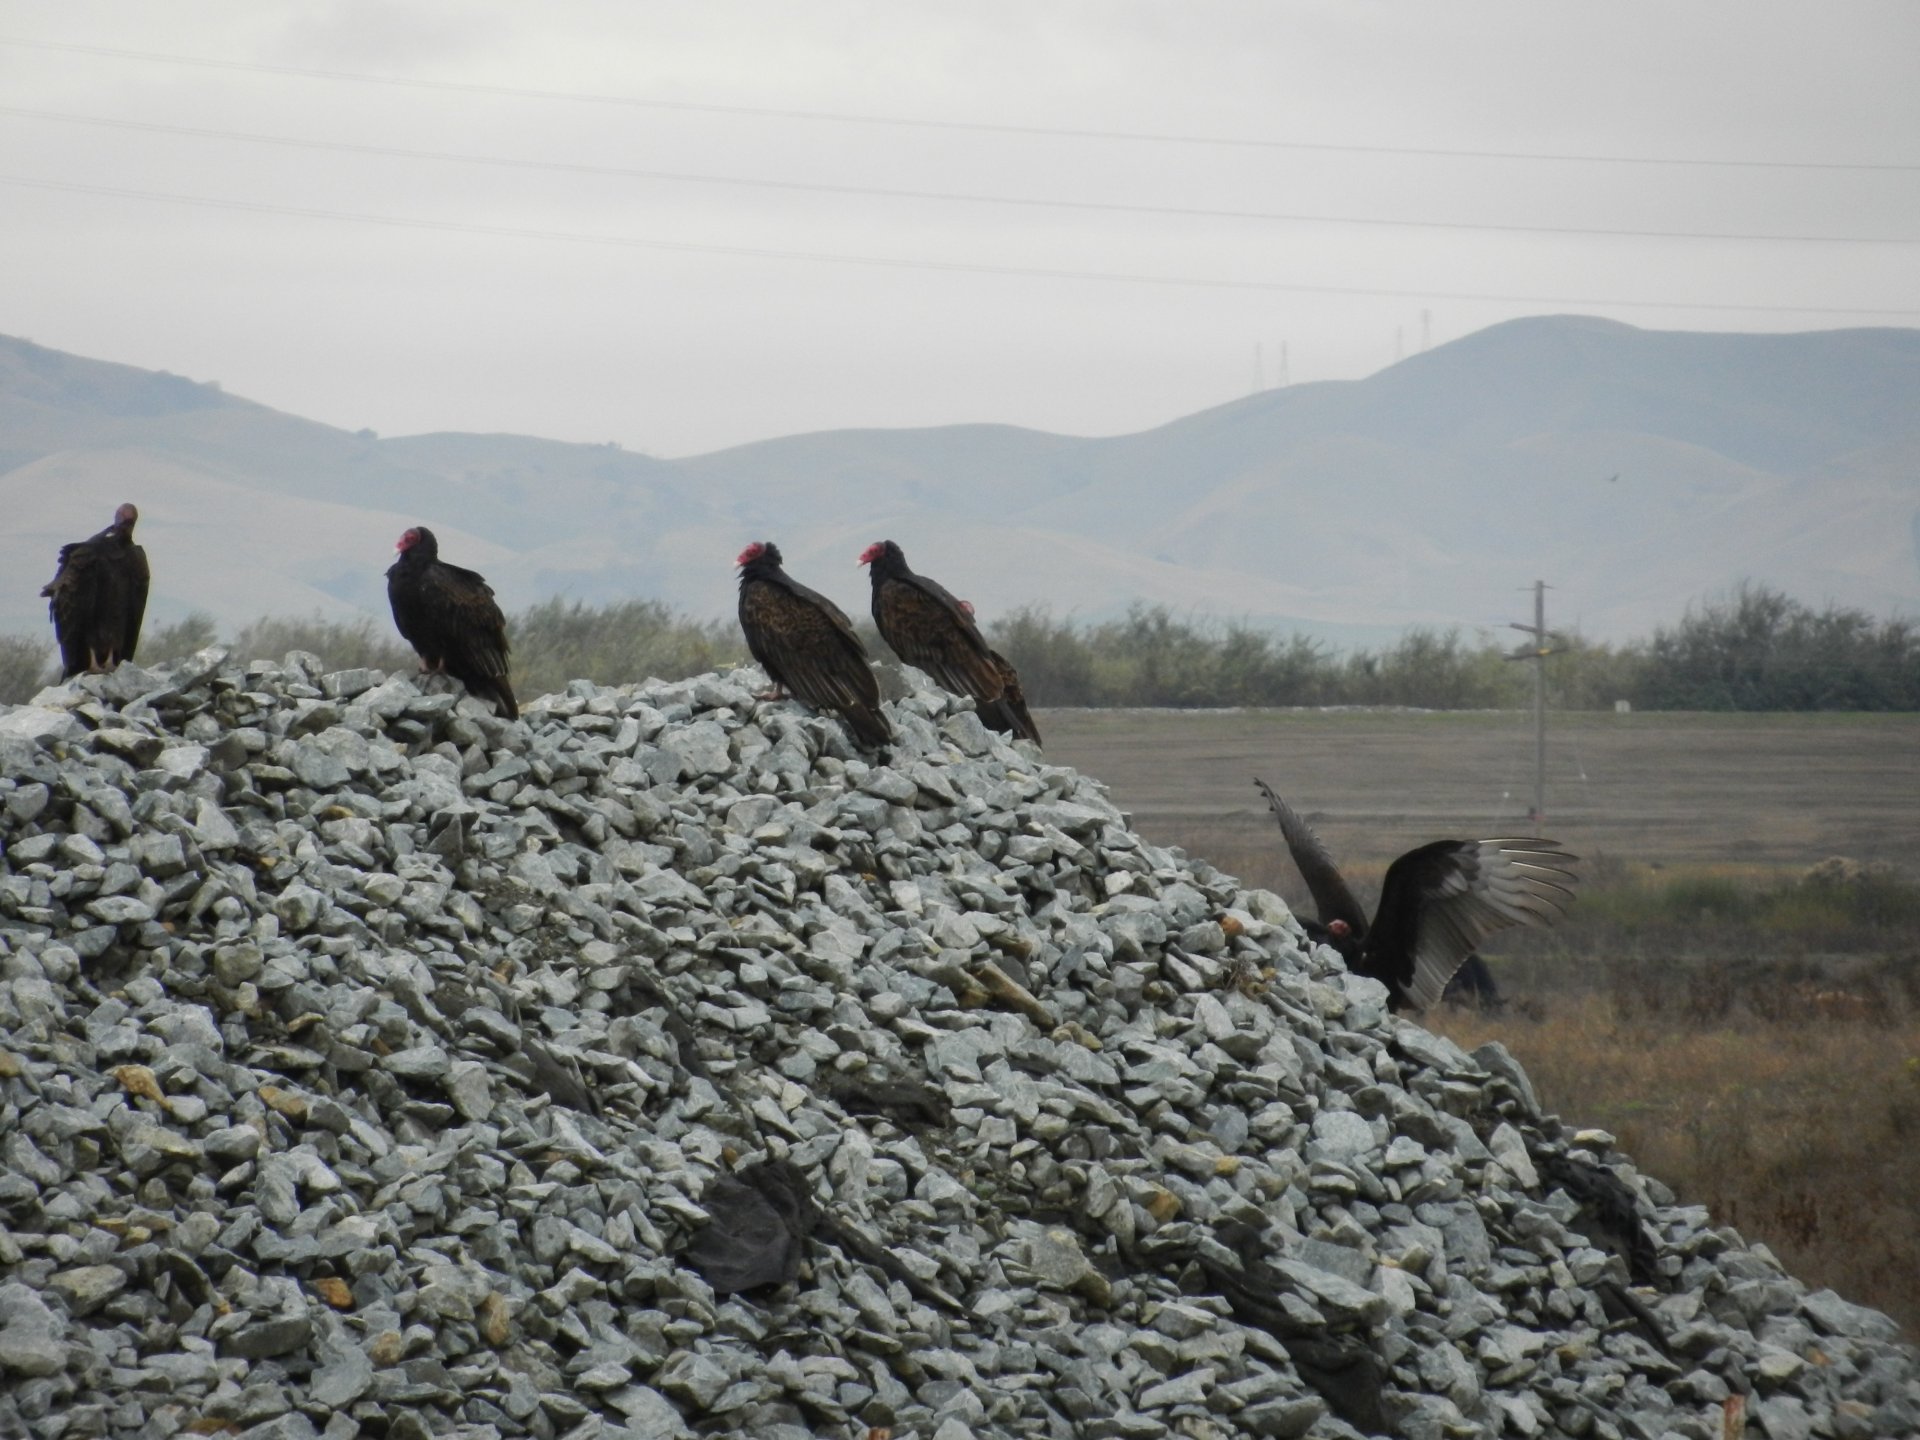
20121129SI_TurkeyVultures.jpg ( 2012-11-29 12:14:43 ) Full size: 1920x1440
Turkey vultures on pile of rocks
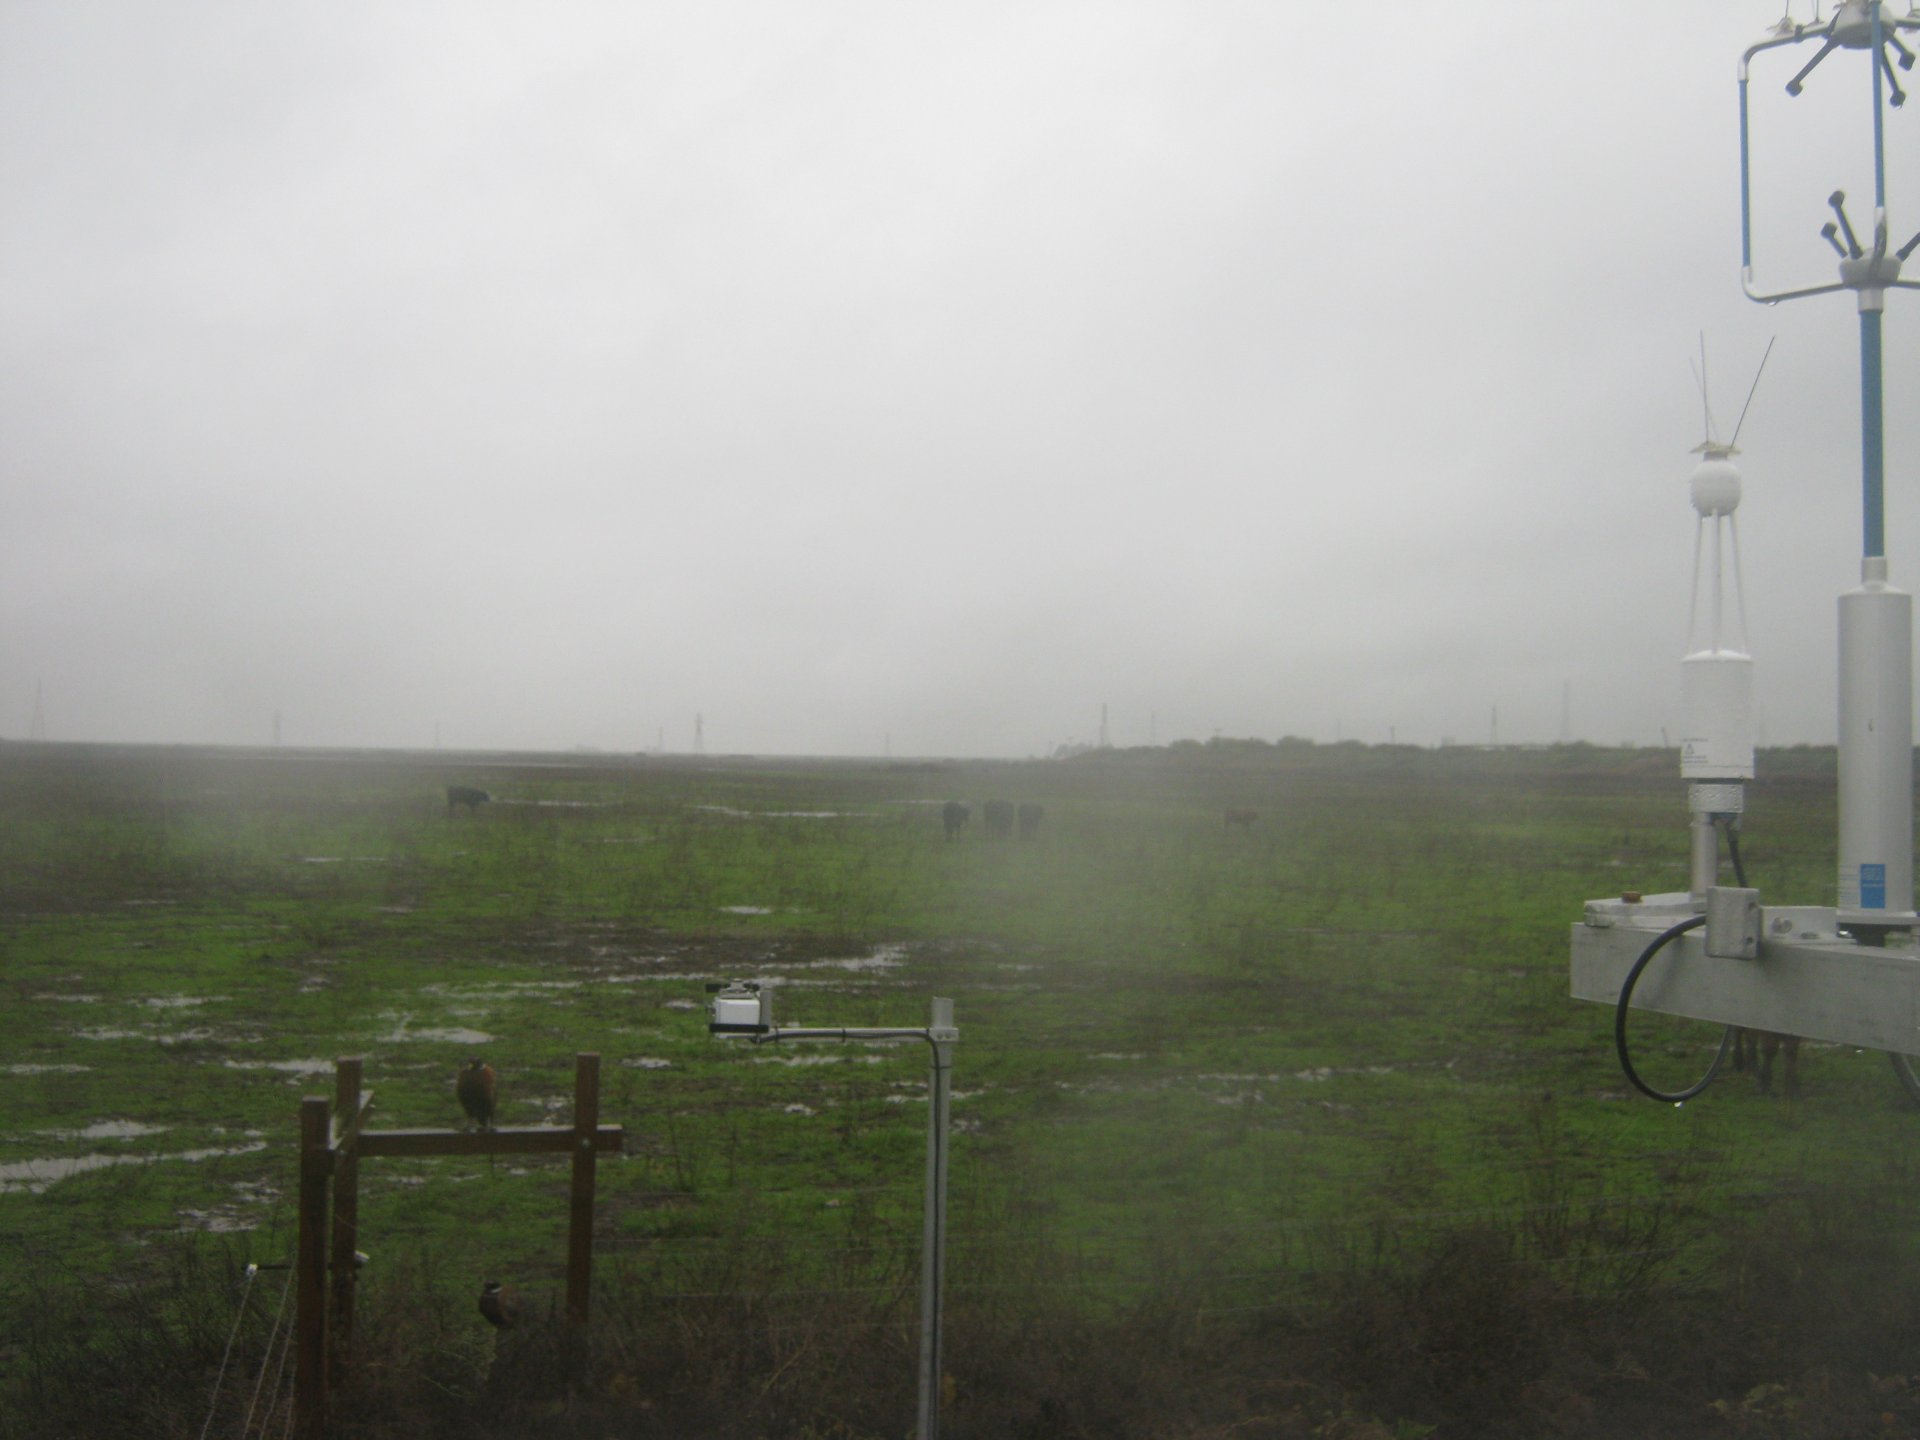
SI_autocam_20121130_1015.jpg ( 2012-11-30 10:15:02 ) Full size: 1920x1440
Rain and phesants
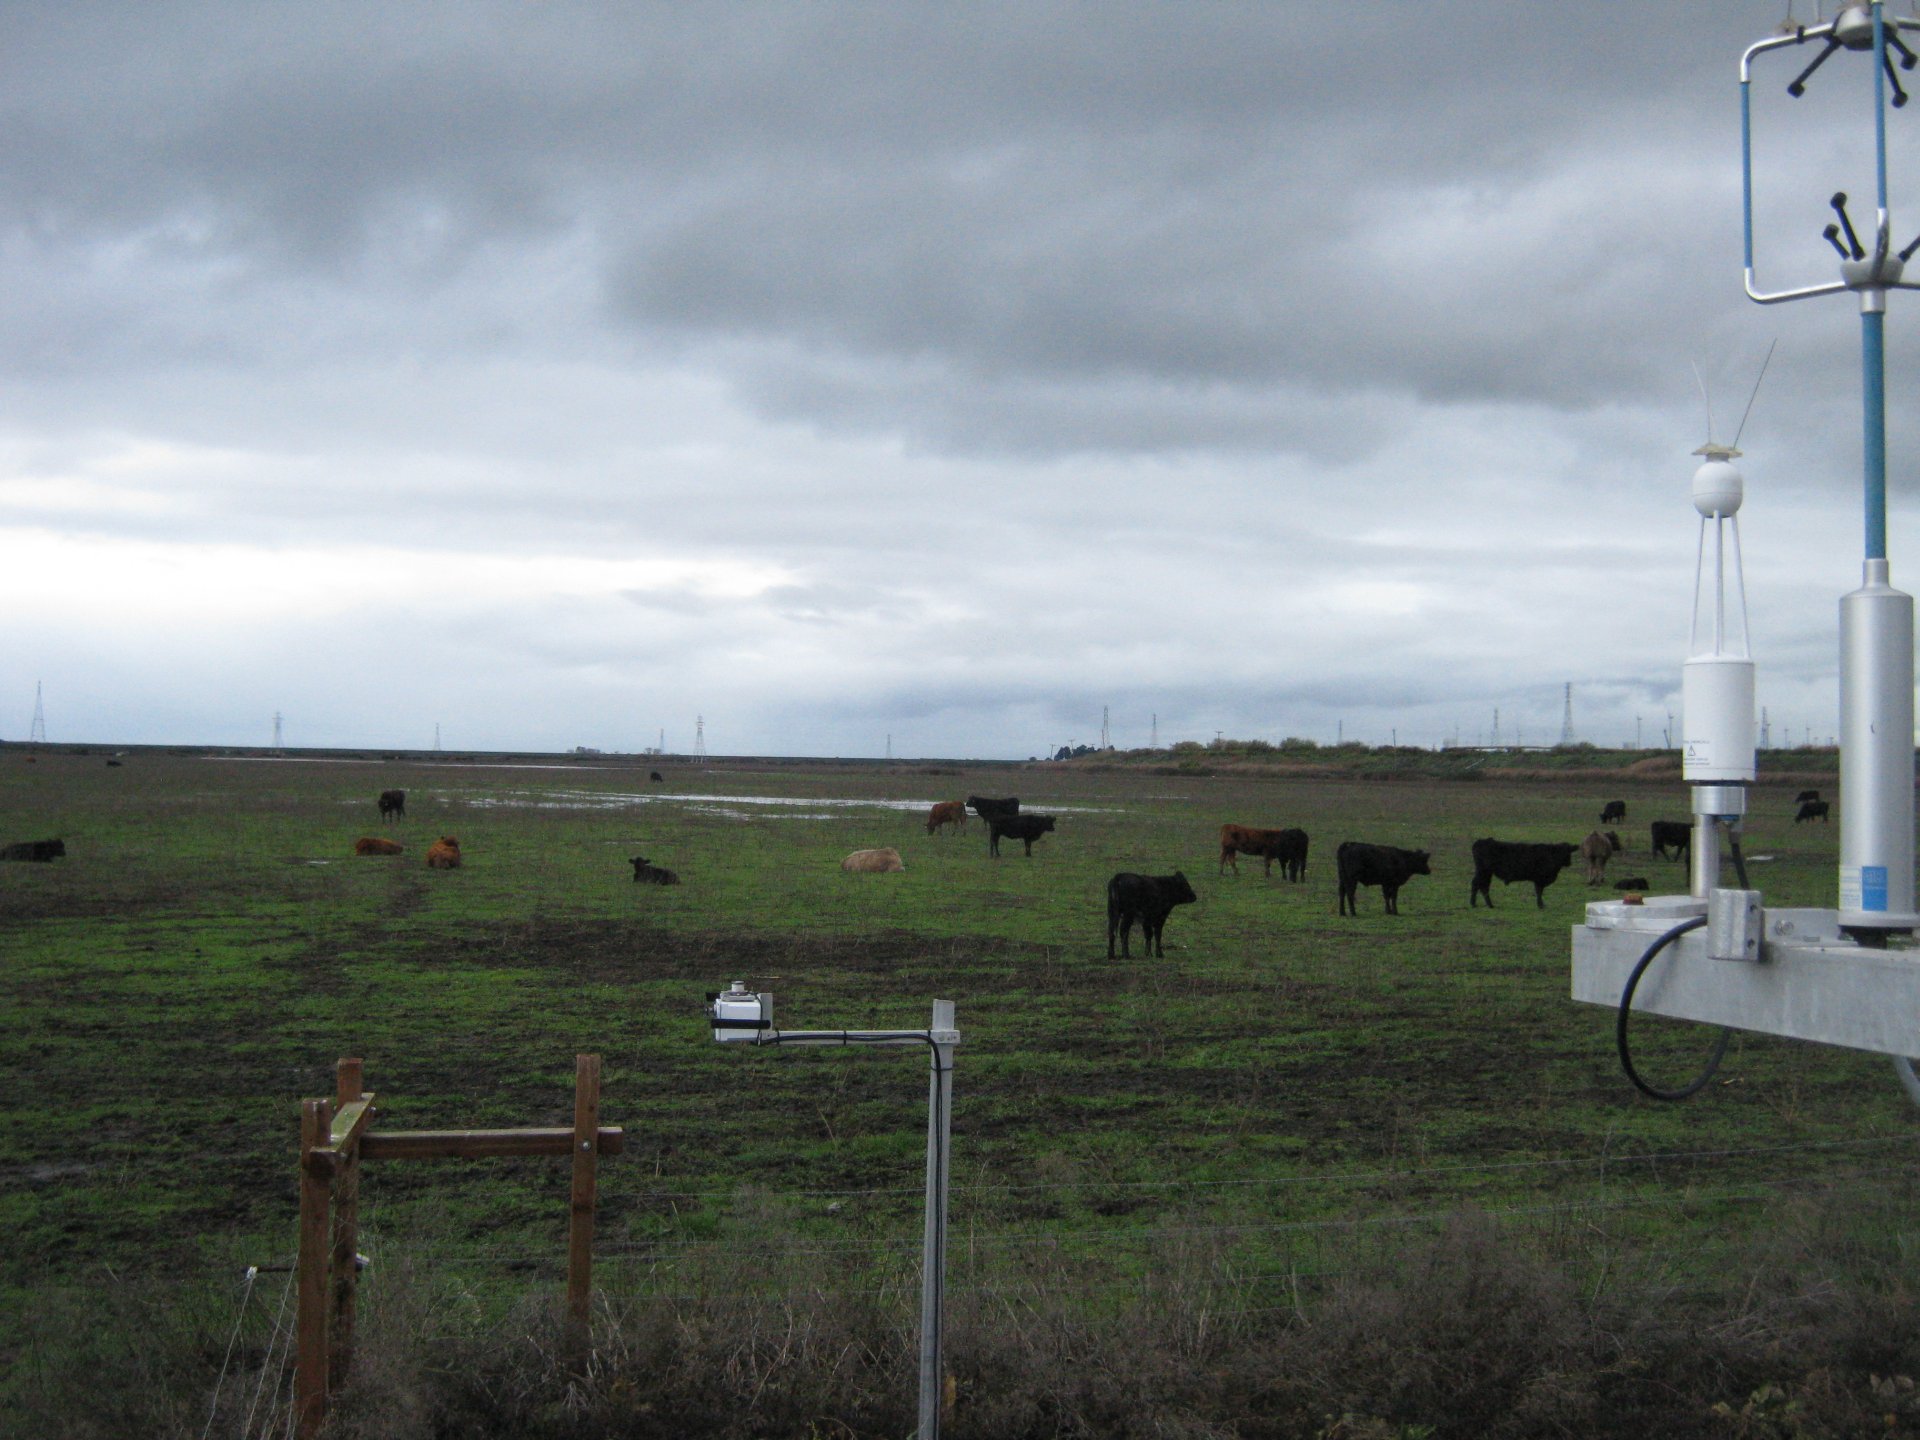
SI_autocam_20121130_1645.jpg ( 2012-11-30 16:45:02 ) Full size: 1920x1440
Cows and standing water
7 sets found
No data found for SI_mp.
11 SI_met graphs found
Can't check SI_mixed
2 SI_mixed graphs found
4 SI_flx graphs found
3 SI_soilco2 graphs found
Can't check TWSI_mixed
Can't check SIMBTWEE_met