
Field Notes
<--2012-01-04 09:30:00 | 2012-01-18 09:30:00-->Phenocam link: Searching...
Tonzi: 2012-01-06 09:00:00 (DOY 6)
Author: Joe Verfaillie
Others: Richard Cuenca, Yutaka Hagimoto, two others
Summary: Meet Richard Cuenca et. al. from OSU who will install three soil moisture stations, brought tram in for repair, extneded spikes on 7500, changed names on Stardot and webcam files, did not fix CO2 profile.
| Tonzi
2012-01-06 I arrived about 9am. It was clear, cool and sunny with almost no wind. Later in the day there was a breeze at the top of the tower and a little at ground level too. Some high thin clouds moved in. Things look very dry. The grasses are dying. Cows have mowed the grass outside the cow fences especially at the soil CO2 enclosure. There were also at least three gray squirrels running around. Most times these guys are shy and you only get to see their tail as they run away. I wonder if the strange weather has got these guys confused. I met Richard Cuerca and Yutaka Hagimoto from OSU along with two others. They will be installing soil moisture, soil water potential, temperature, and ppt sensors at three locations and a Hukseflux NR01 at one location. They will work at Tonzi Friday, Saturday and Sunday (Jan6-8). Their first location is near the middle of the soil co2 cow fence. Their second location is near the tower to the south east. And their third location is further to the southeast outside on the cow fence. They will put up a small fence like the sap flow stations around the third location. They are digging pits to 80cm and taking cores for soil properties. They tried a spot near the floor solar panels but the soil was too shallow about 40cm. I worked on the tram. It had stopped toward the east end of the track. The battery read 3V - I hope it's not killed. I swapped the battery and nothing happened. I connected to the data logger with a net book and it program was there, but its memory was corrupt. So I decided to reload the program. The copy of the program I had didn't quite match the wiring in that C3 was used to control a relay to power the motor driver, but there was no call to set C3 high in the program I uploaded. About this time I also discovered that the data logger time was bad and probably contributed to the tram not running in that it thought it was midnight. The data logger also lost its time on a power cycle after I reset it, so its internal battery is probably bad. I added a set port 3 high to the program and the tram started to move, but the motor near the sensors was turning very slowly and may be bad. At this point I decided to bring the tram in for maintenance. Next I added longer spikes to the LI7500 on the tower. I just cable tied longer pieces of wire to the existing ones. I'll do a better job in the lab to make longer spikes on the 7500s. I also swapped the HMP45 shield at the tower top that had a bad fan. A new shield with good fan was installed. All the sensors on the tower top looked clean. I cleaned the windows on the z-cams I was going to put the Li-820 into the co2 profile system but I left its power and data connector in the lab. I'll have to do that next time. I fixed the naming of the stardot files and changed the naming of the web cam files to match the archives. The wire to the north sap flow station has been chewed. I had removed the wires to the sap flow stations from the trees a couple months ago because one of the ranchers had told me that the wires were dangerous to the cowboys riding through. We need to come to some decision on whether to spend some money and time on the sap flow stations or to remove them. All readings looked okay on the data loggers and winflux. I left about 1pm |
Field Data
No tank data
No TZ Well data found
No TZ Moisture Point data found
No VR Moisture Point data found
No TZ grass heigth found
No VR grass heigth found
No TZ Tree DBH found
No water potential data found
No TZ Grass Biomass data found
No TZ OakLeaves Biomass data found
No TZ PineNeedles Biomass data found
6 photos found
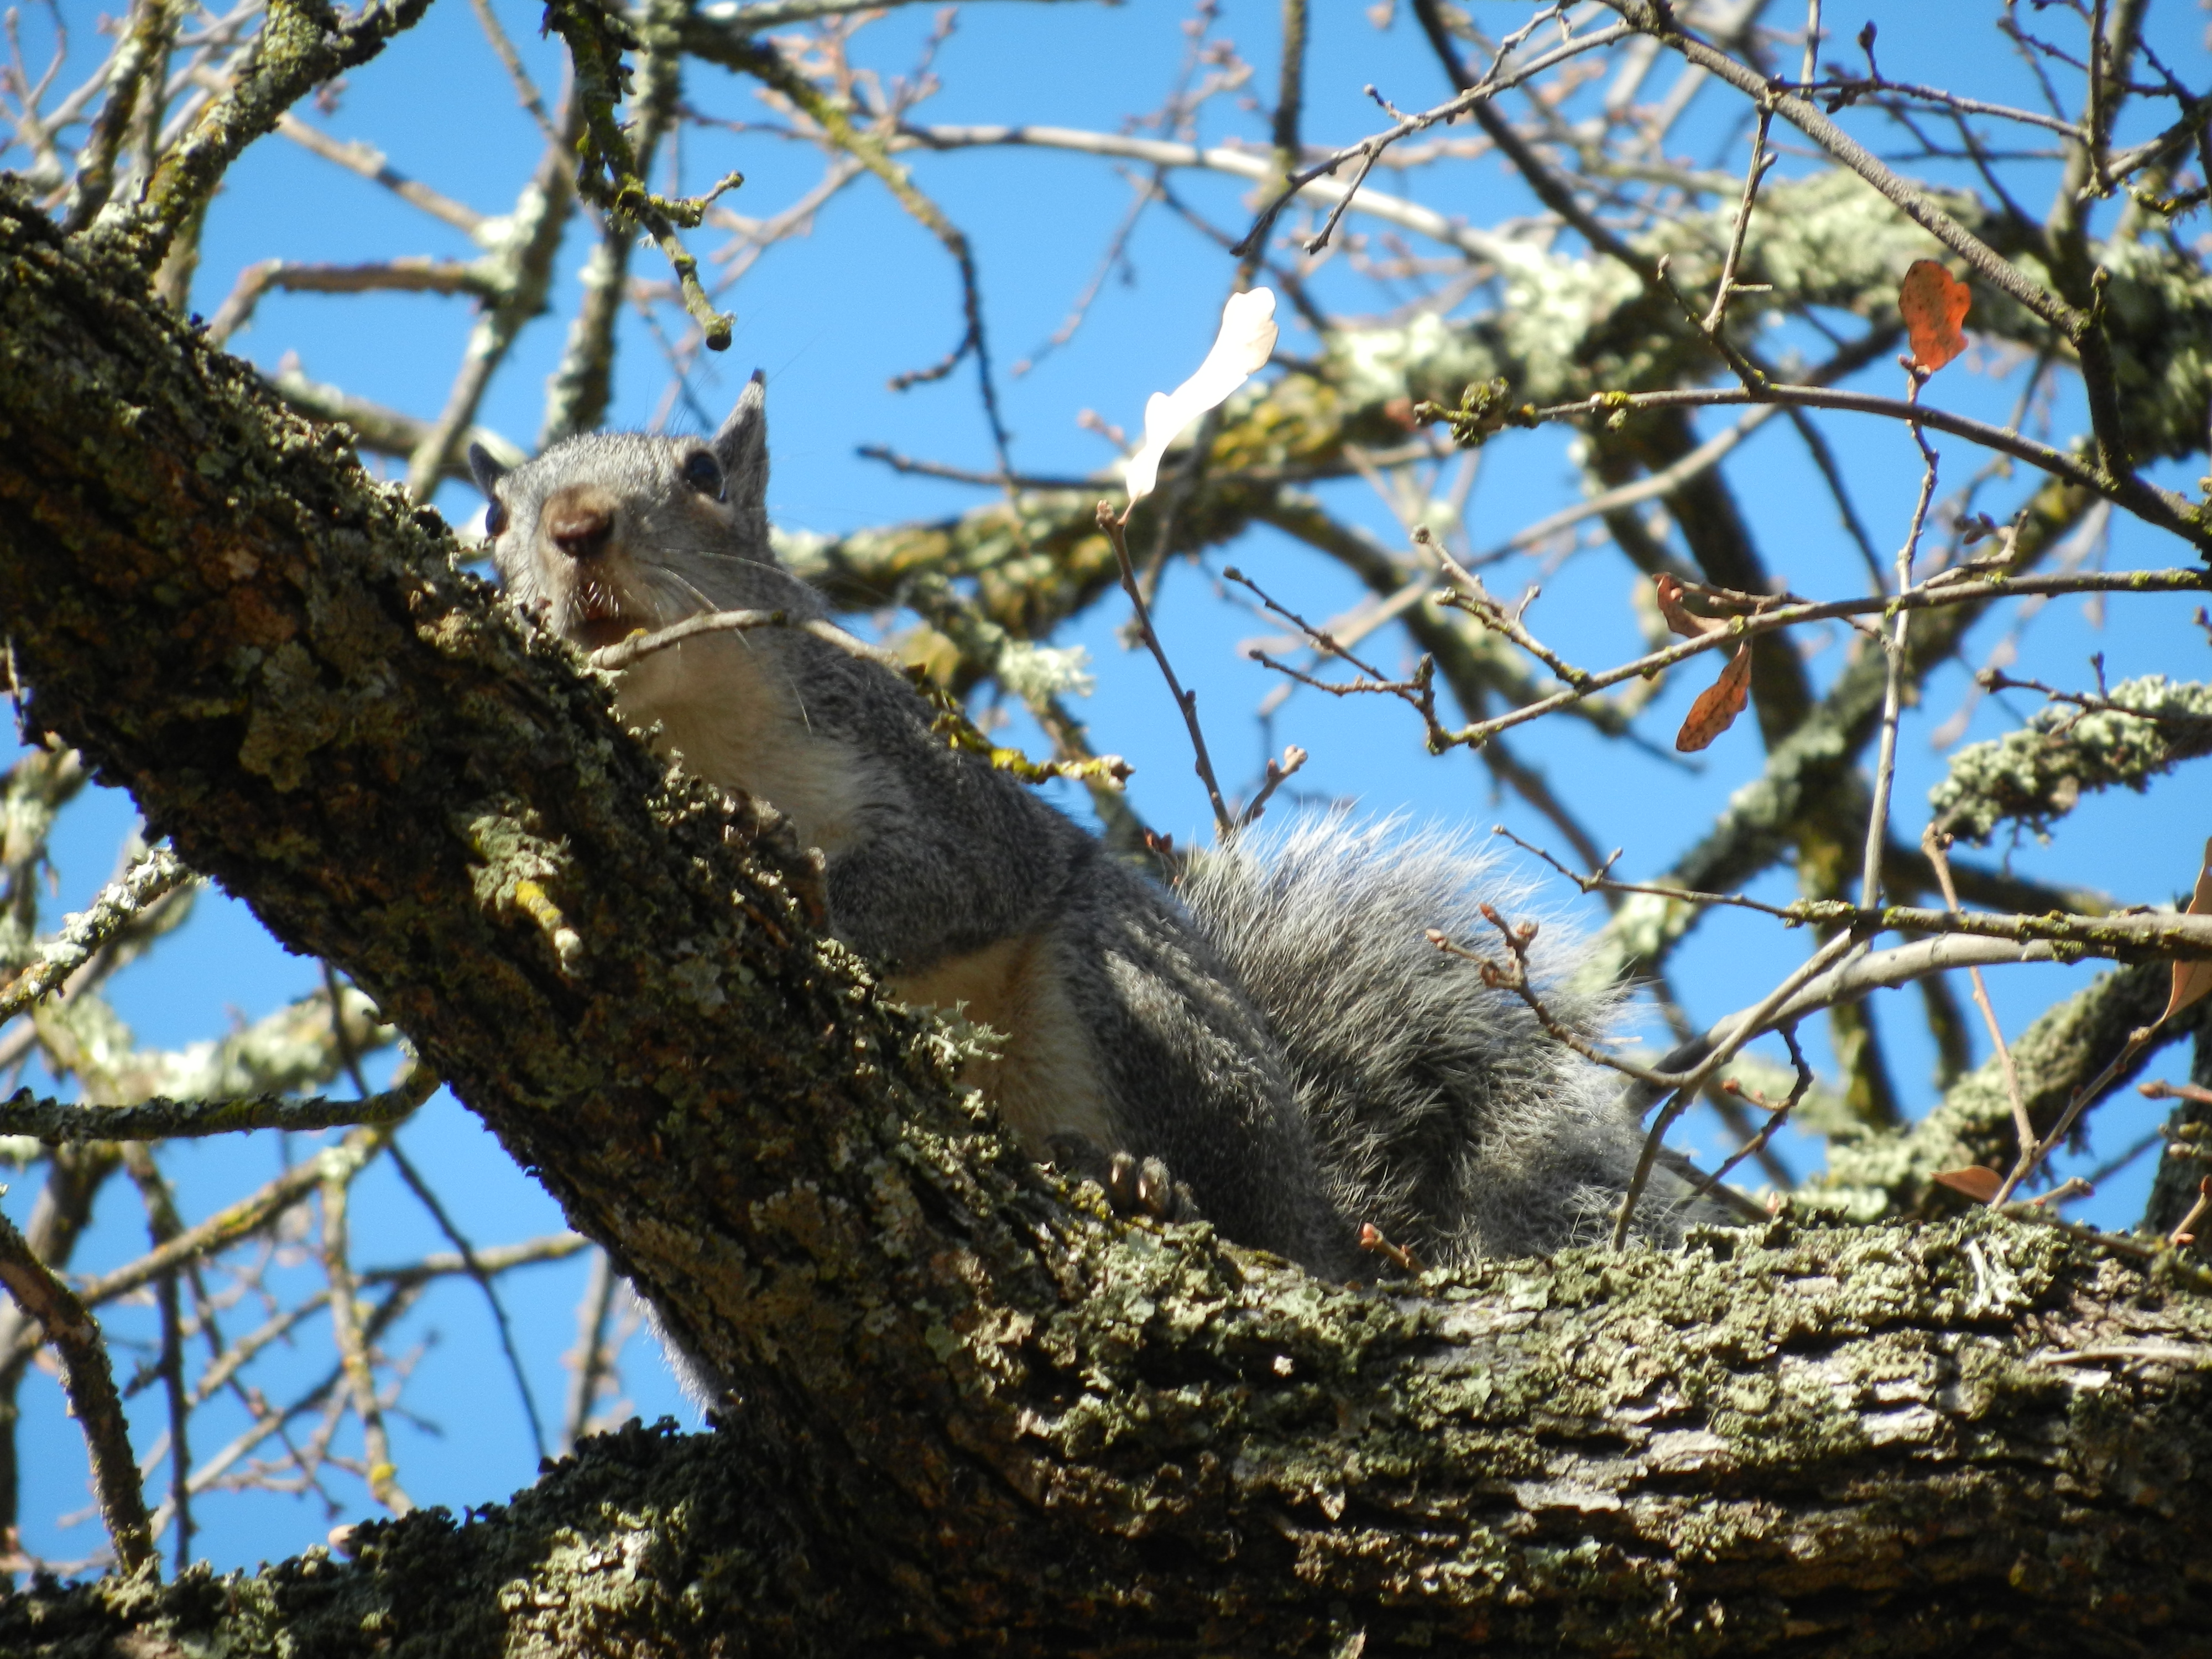
20120106TZ_GraySquirrel.jpg ( 2012-01-06 12:06:25 ) Full size: 4000x3000
Gray squirrel
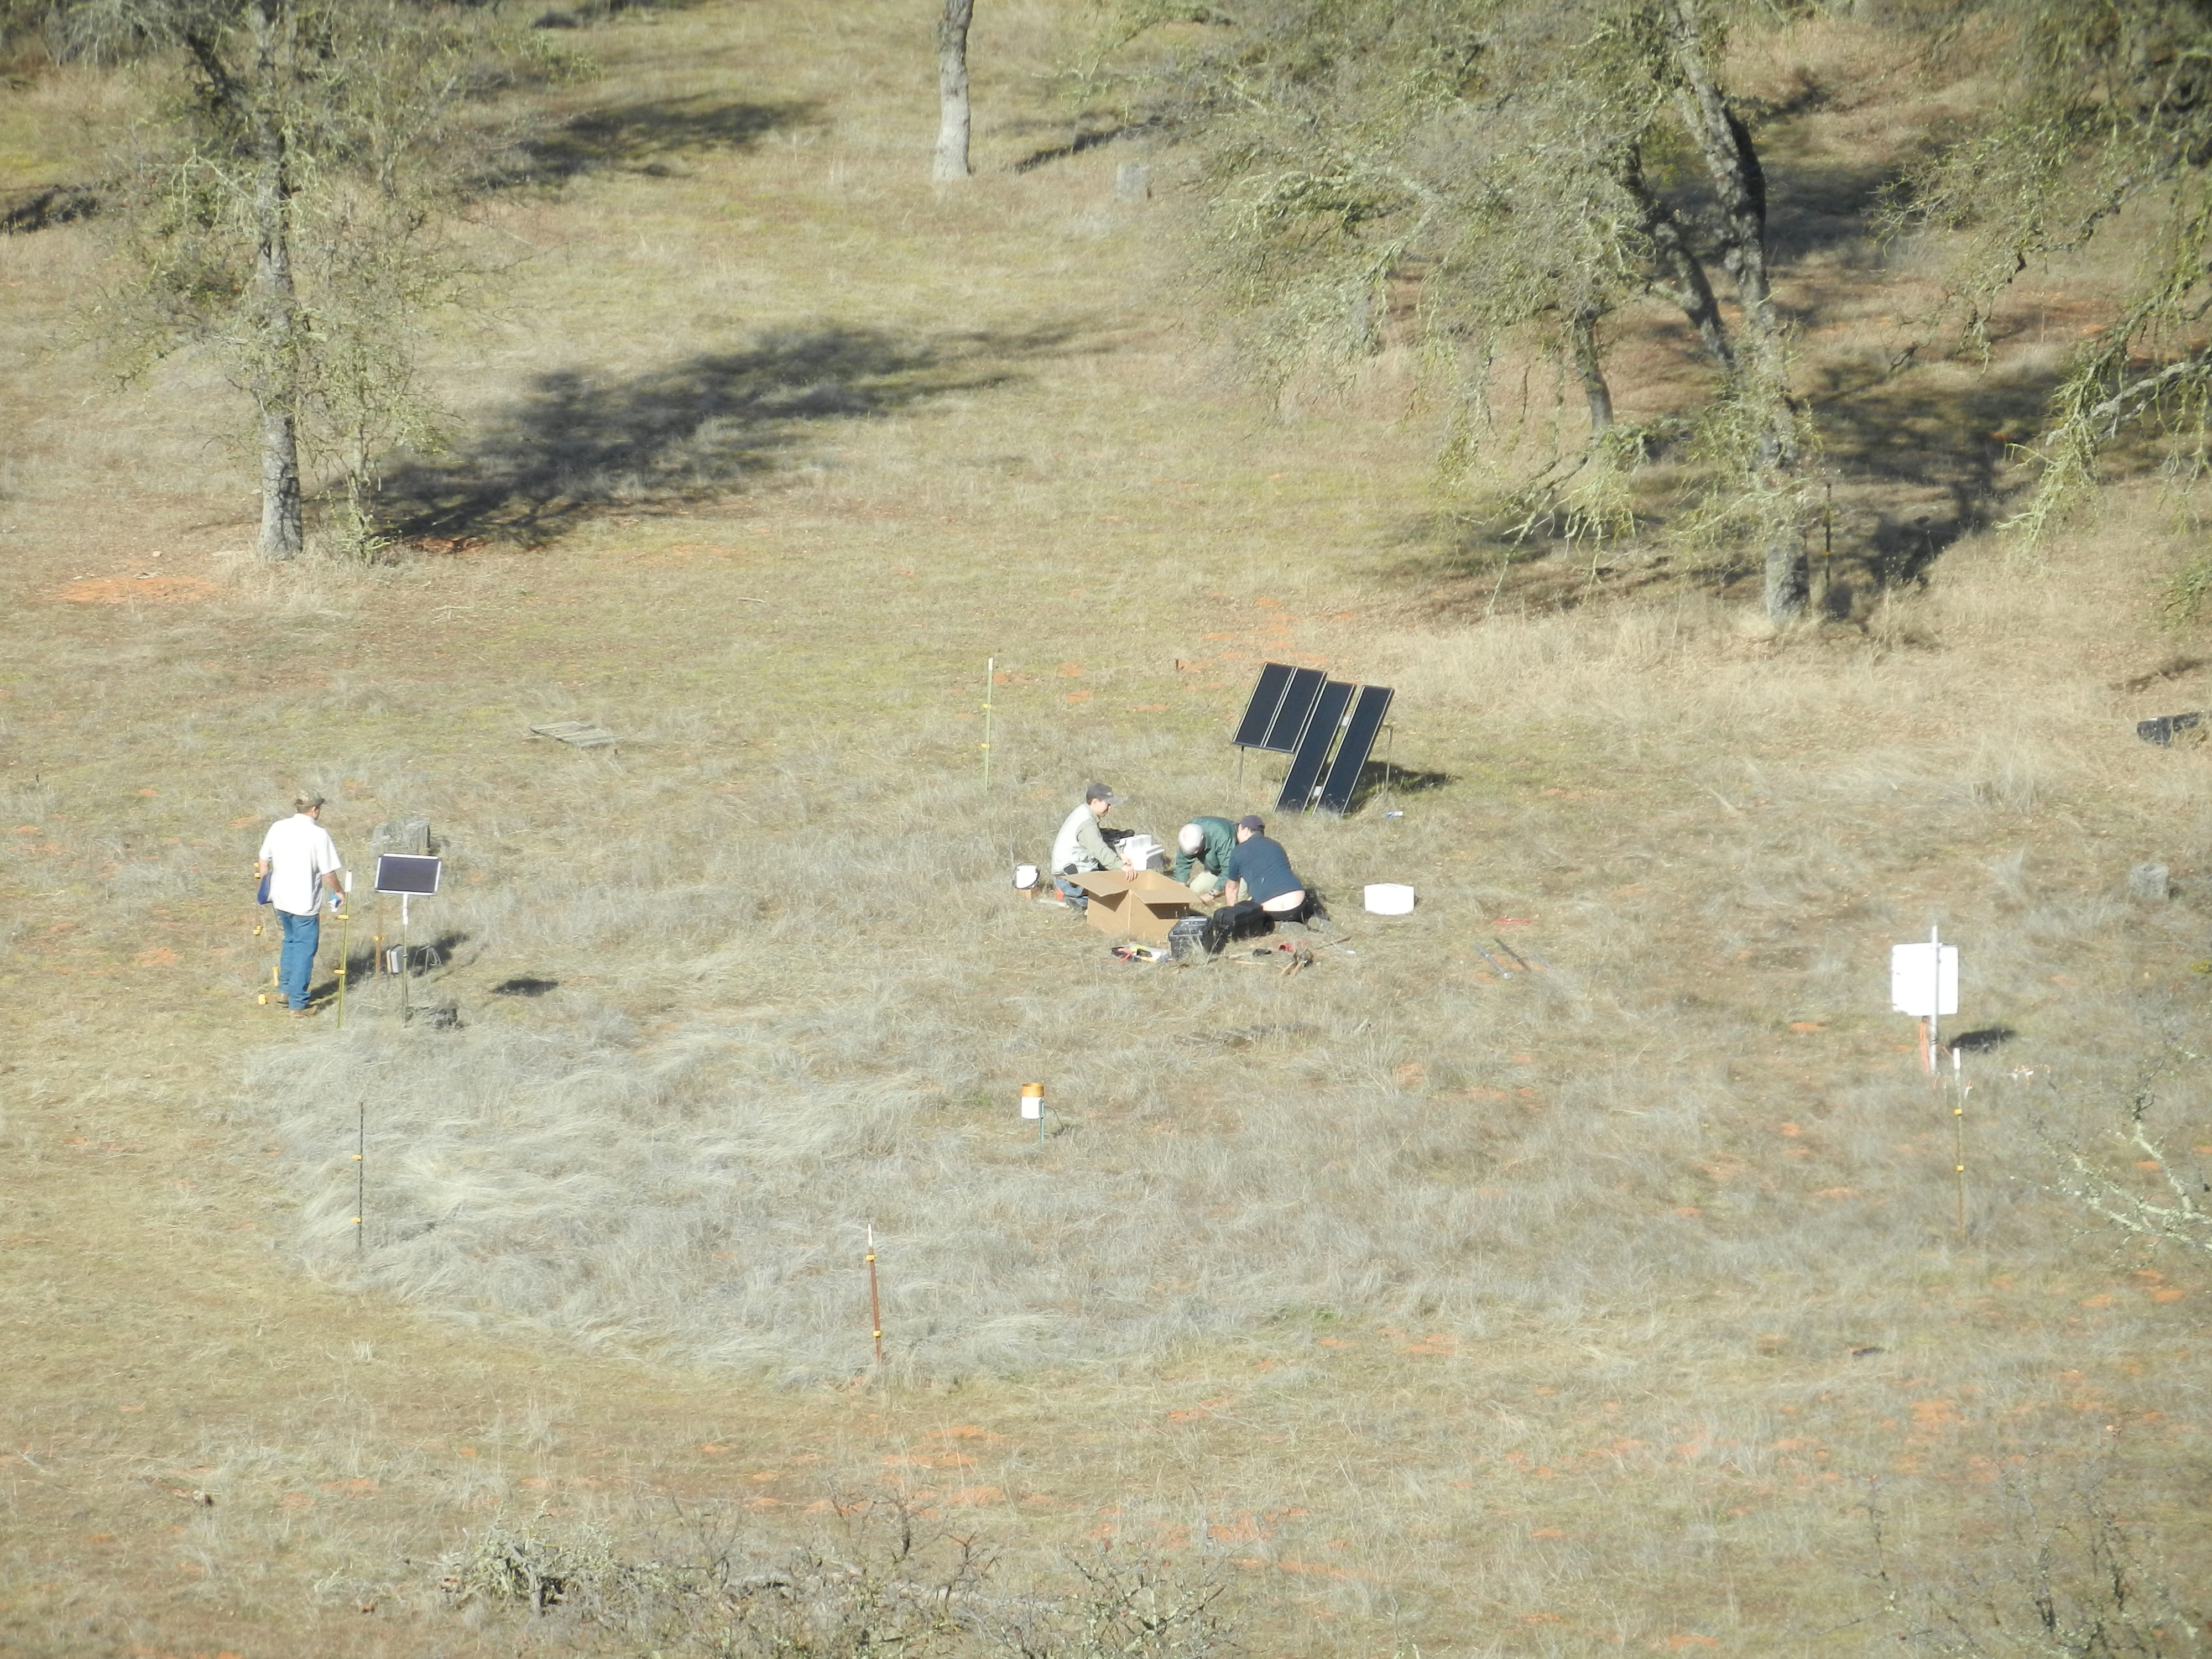
20120106TZ_OSUatSoilCO2.jpg ( 2012-01-06 12:26:24 ) Full size: 4000x3000
OSU crew installing soil moisture station
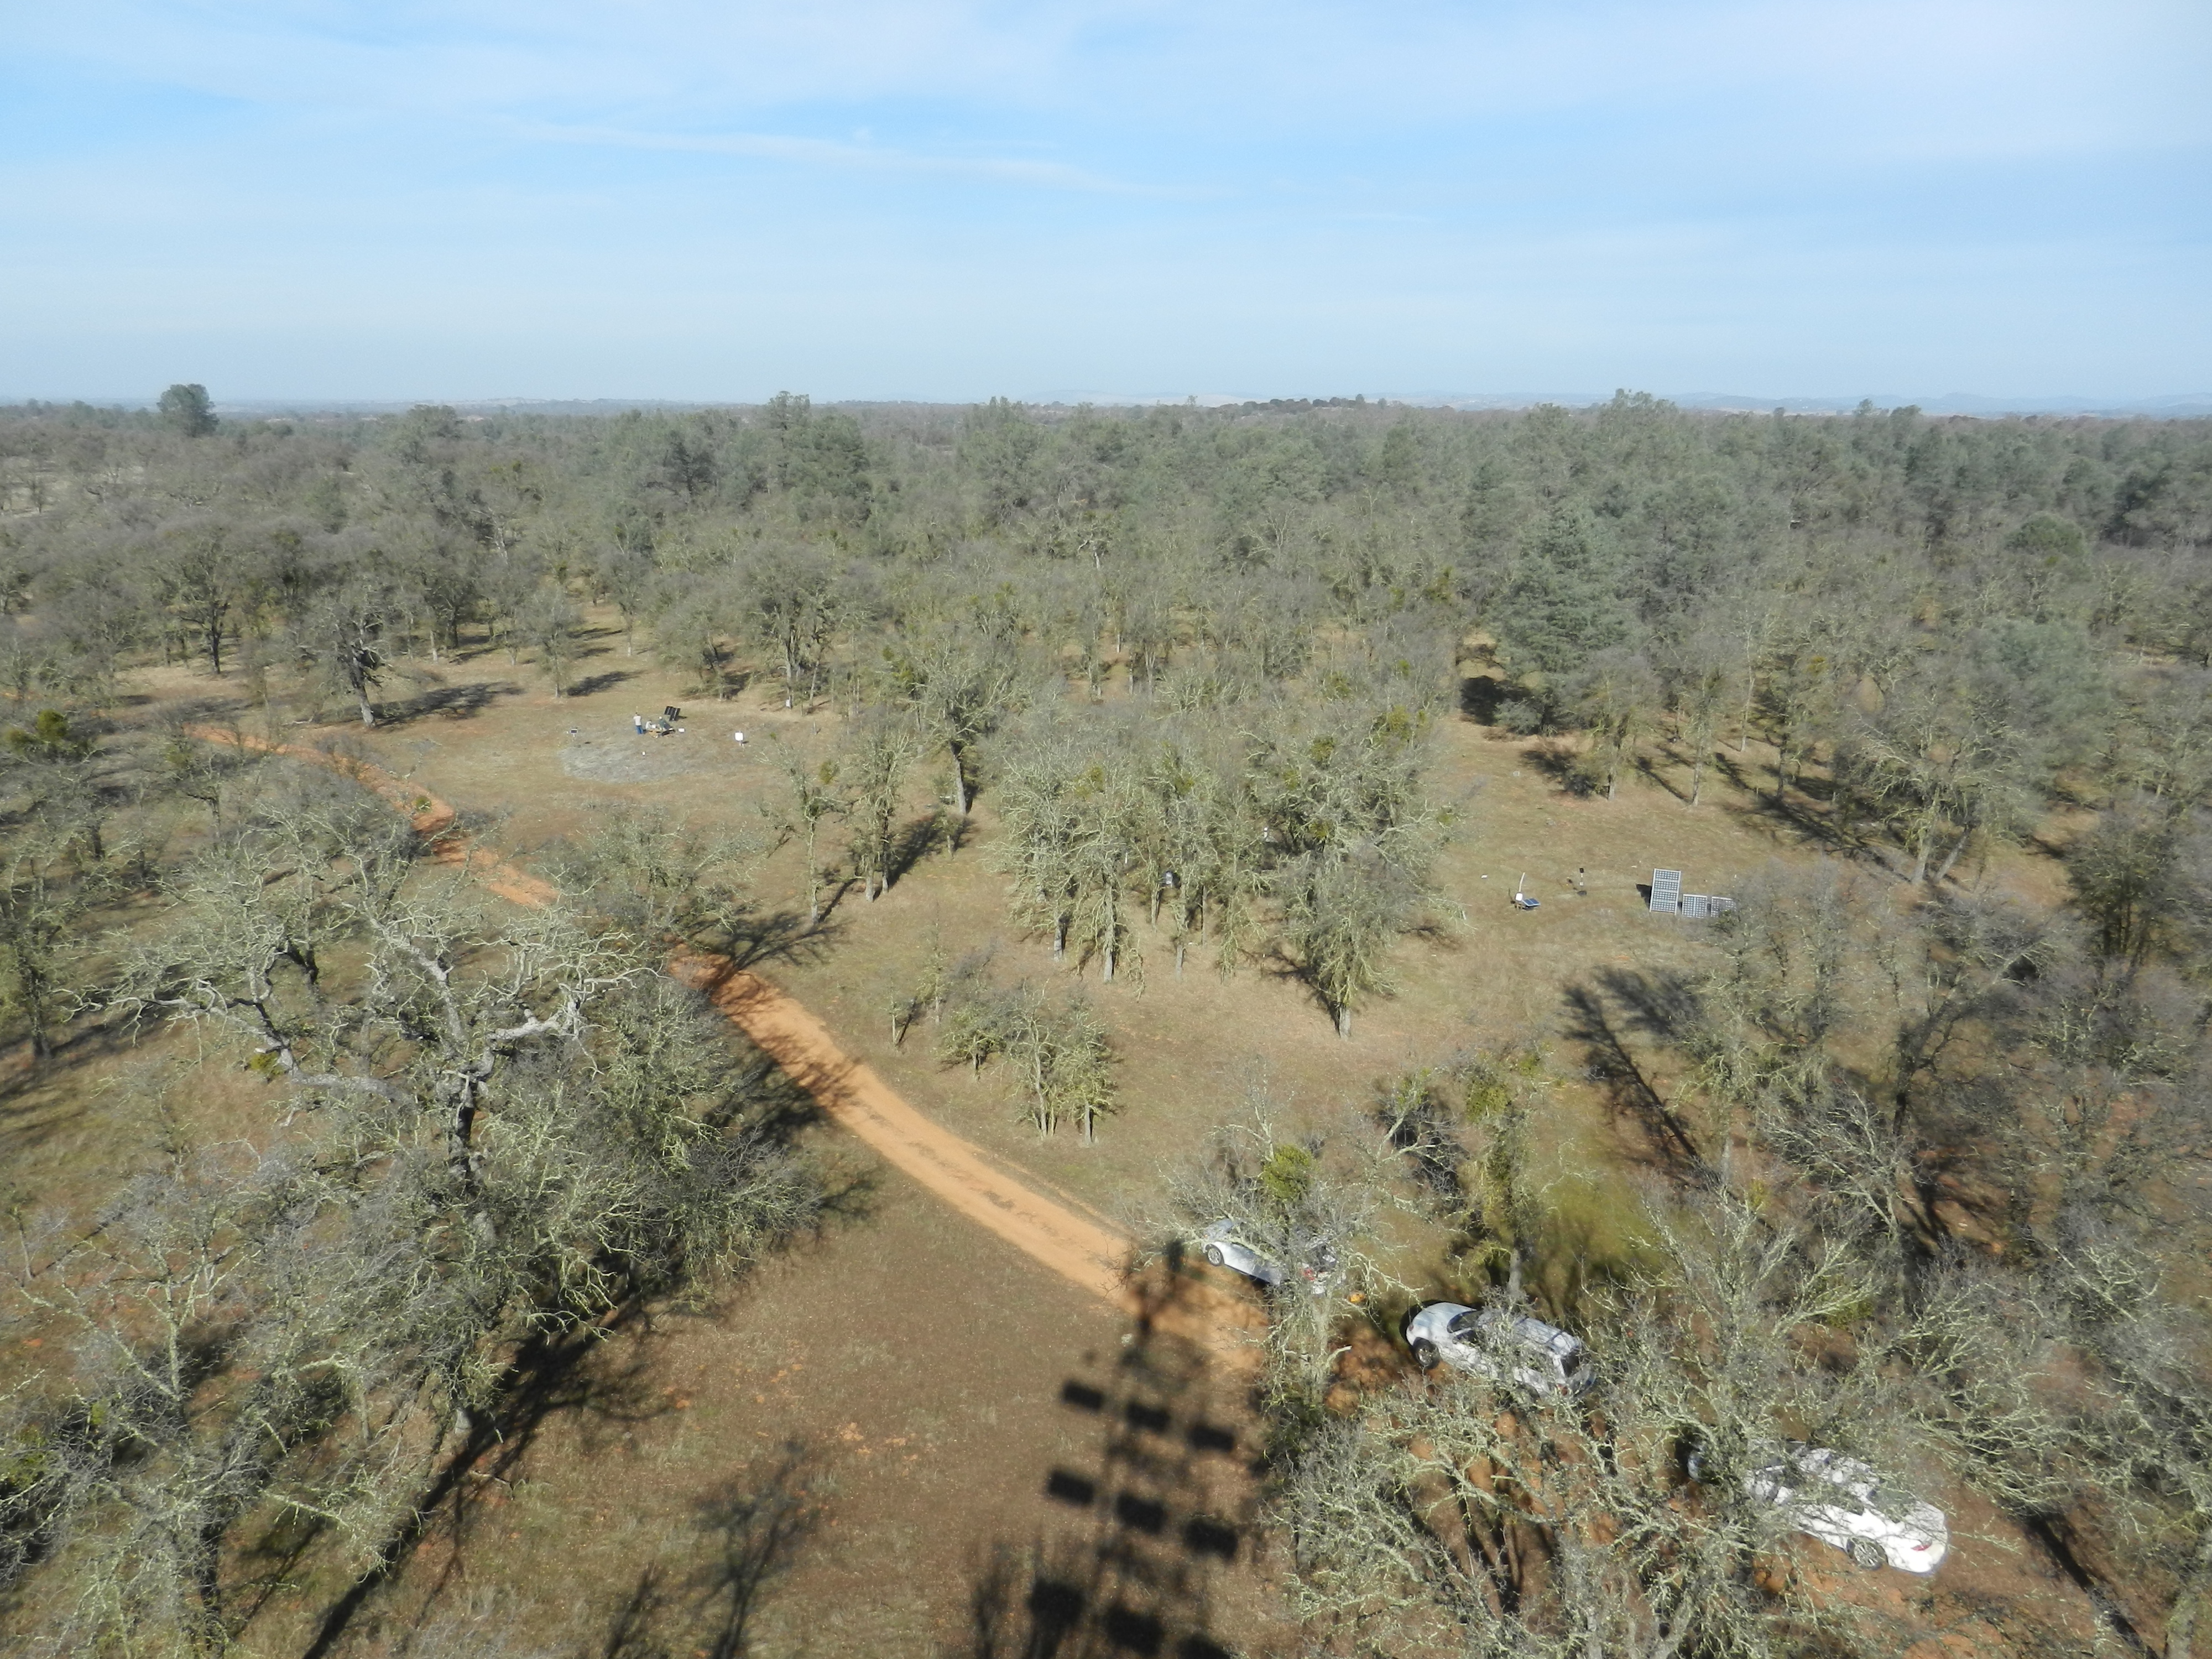
20120106TZ_SiteFromTower.jpg ( 2012-01-06 12:26:54 ) Full size: 4000x3000
View of site from tower
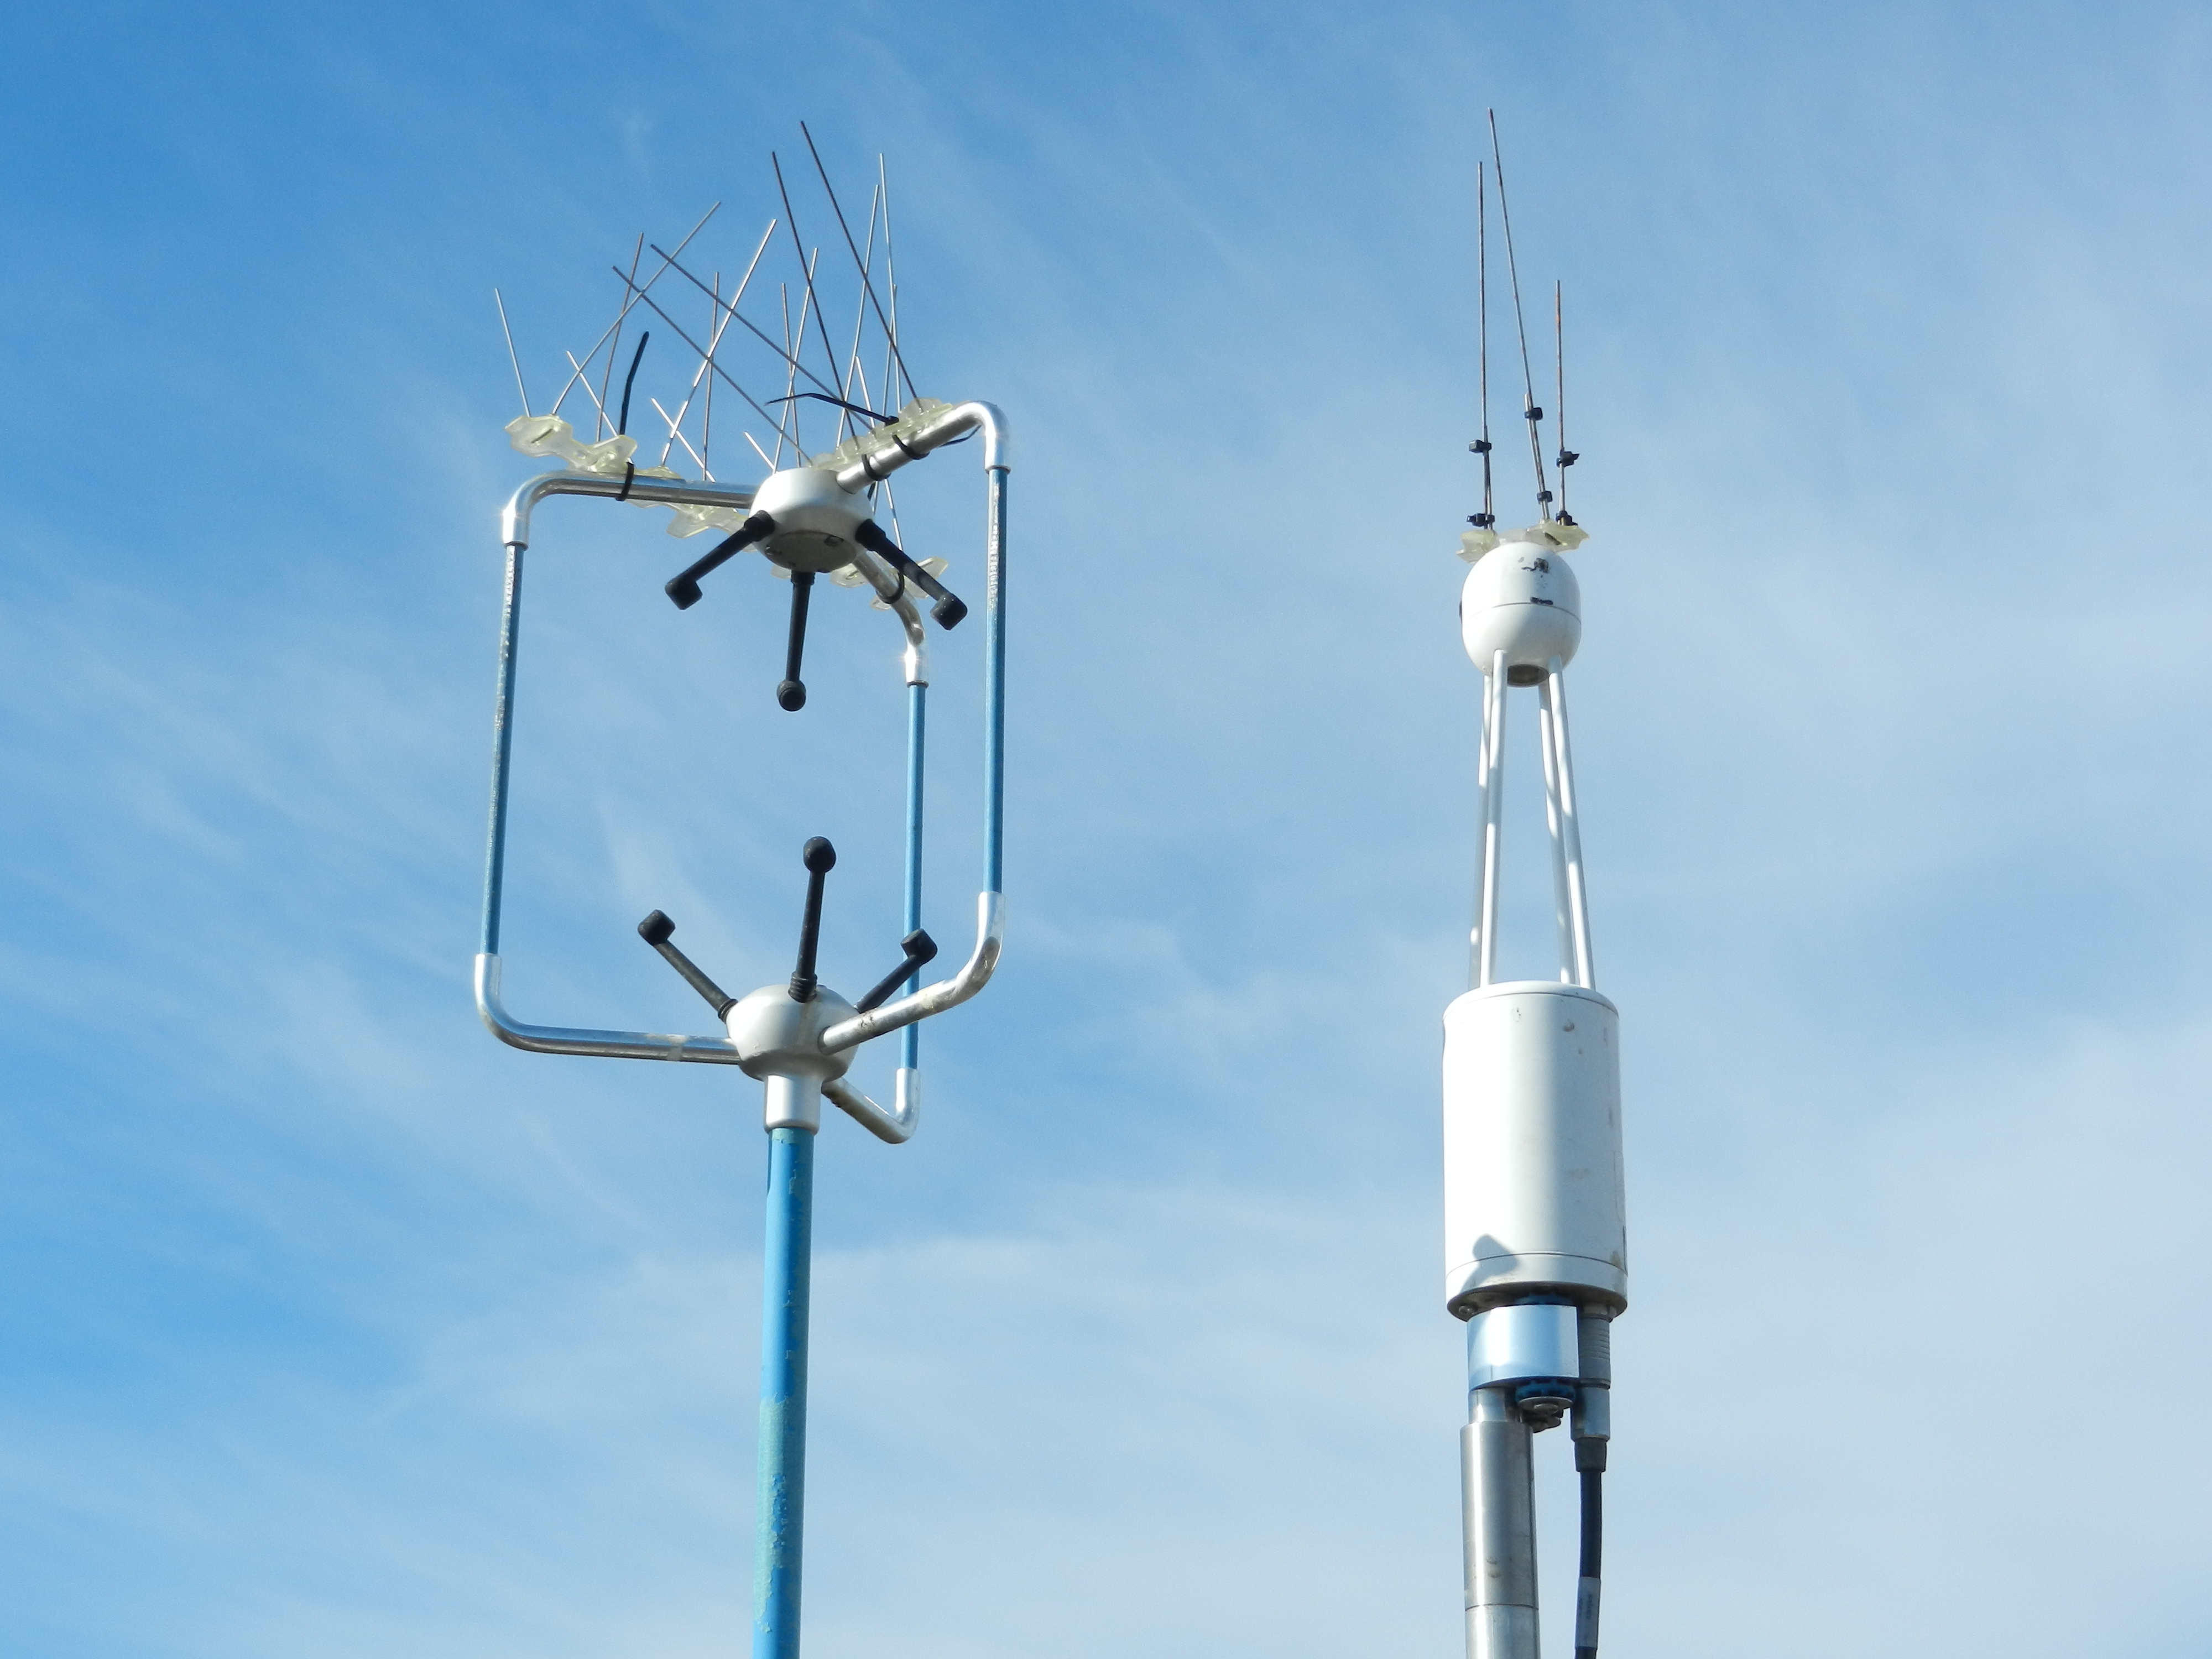
20120106TZ_SonicIRGA.jpg ( 2012-01-06 12:26:02 ) Full size: 4000x3000
Sonic and IRGA at top of tower
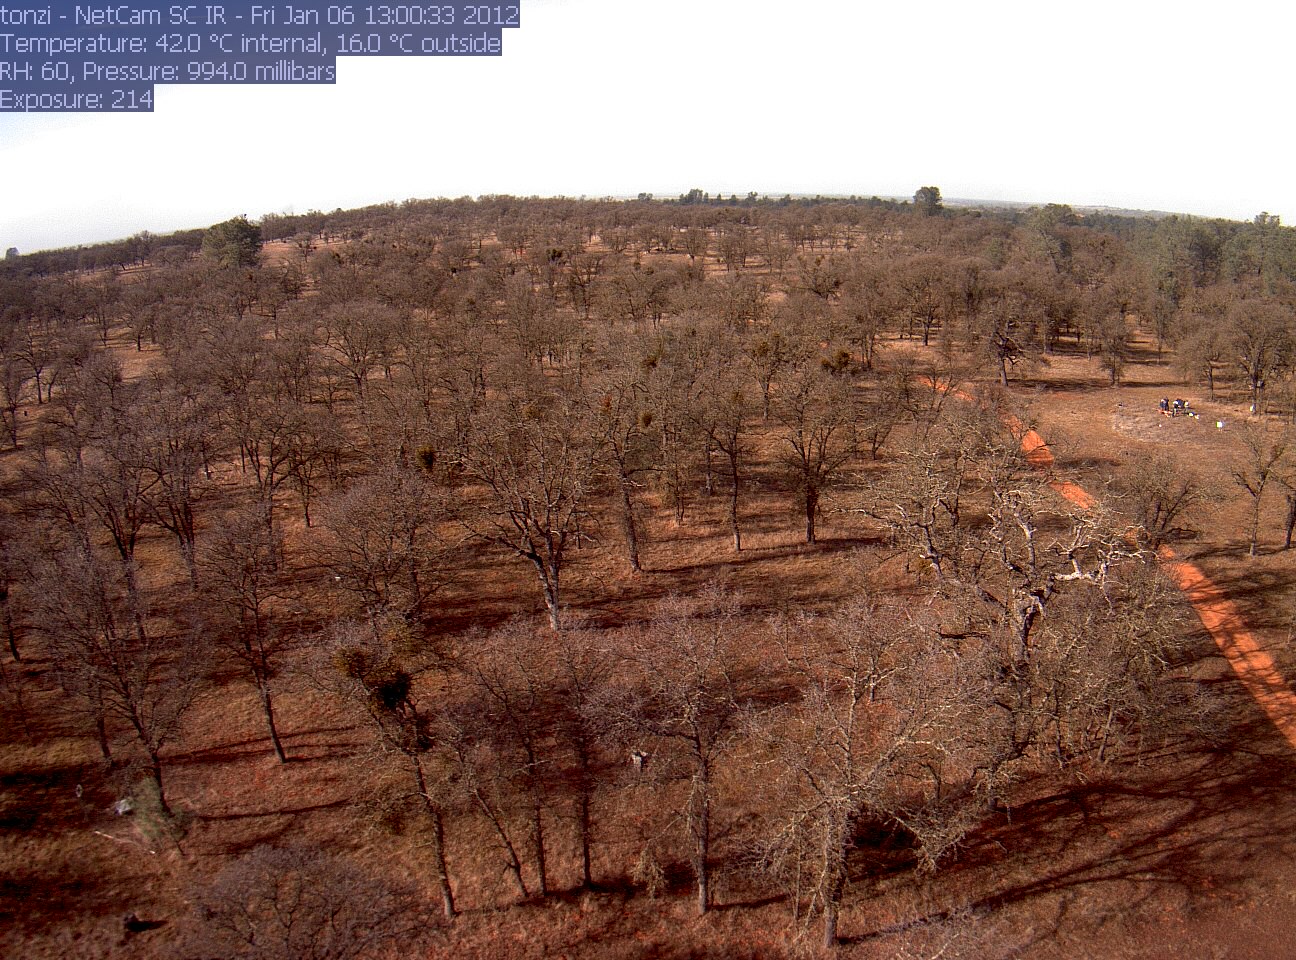
tonzi_2012_01_06_130102.jpg ( 2012-01-06 13:01:14 ) Full size: 1296x960
OSU installing soil moisture at soil CO2 enclosure
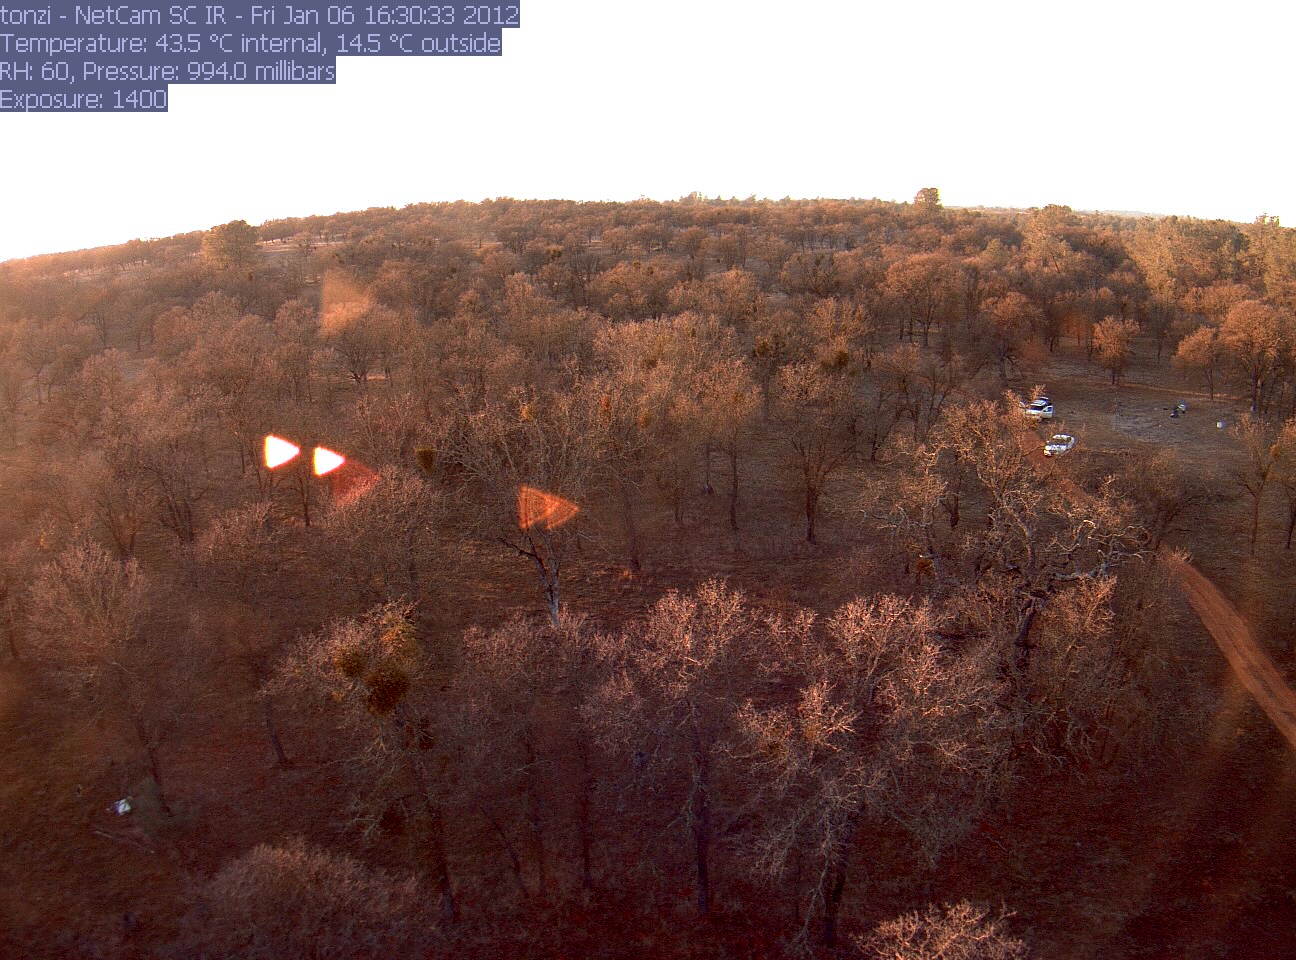
tonzi_2012_01_06_163101.jpg ( 2012-01-06 16:31:14 ) Full size: 1296x960
OSU installing soil moisture at soil CO2 enclosure
16 sets found
No data found for TZ_Fenergy.
11 TZ_tmet graphs found
11 TZ_soilco2 graphs found
Can't check TZ_mixed
3 TZ_mixed graphs found
1 TZ_fflux graphs found
8 TZ_fmet graphs found
No data found for TZ_tram.
3 TZ_co2prof graphs found
No data found for TZ_irt.
No data found for TZ_windprof.
1 TZ_tflux graphs found
2 TZ_sm graphs found
Can't check TZ_met
1 TZ_met graphs found
Can't check TZVR_mixed
No data found for TZ_osu.
No data found for TZ_fd.
Tonzi Z-cam data