Field Notes
<--2012-01-06 09:00:00 |
2012-01-25 11:30:00-->
Phenocam link:
Searching...Tonzi: 2012-01-18 09:30:00 (DOY 18)
Author: Siyan Ma
Others: Sebastian
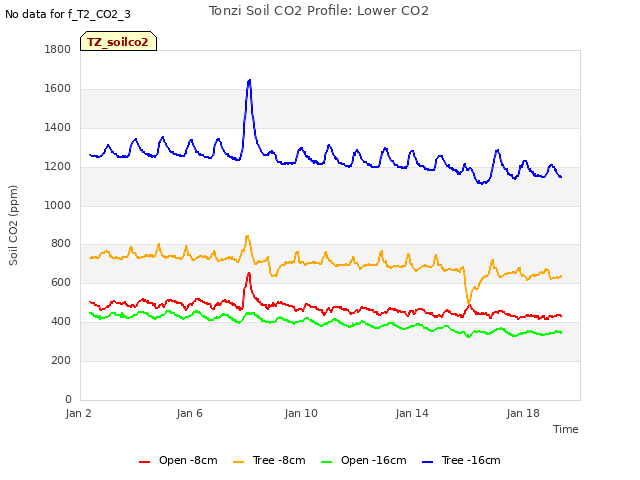
Summary: Tried to reinstall LI820 for co2 profile - didn't work, swapped co2 profile co2 and N2 tanks.
When: Date: 1/18/2012 , Day: 18
, Watch Time: 9:30 am .
Where: Tonzi/Vaira Ranch
Who: Siyan, Sebastain
Weather: cloudy, very stable, almost no wind
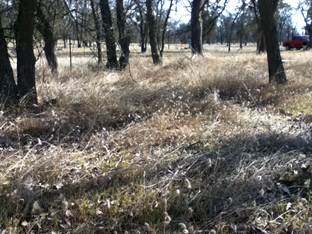
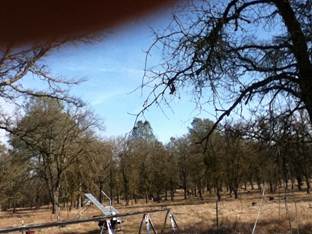
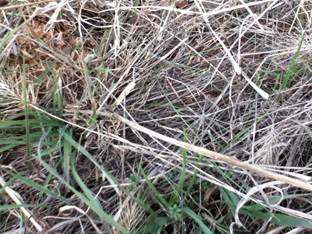
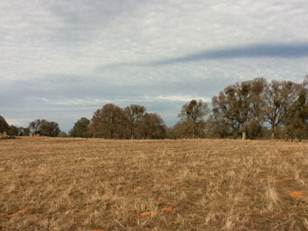
Phenology: grasses looked more brown due to no rain, no
oak leaves
Summary
- checked and downloaded data at Tower, Floor, and Vaira
- tried installing Li-820 back to the CO2 profile system
but failed; found disconnection of the black power wire. The problem has
been reported to Joe, and he will go to the field soon.
- Swap the N2 and CO2 tanks for calibrating the CO2
profile. (with Sebastian?s help.)
- Read dendrometers
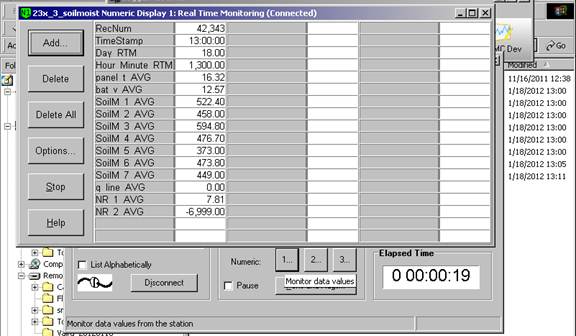
- Measured soil moisture (Sebastian did it.)
- Measure groundwater well:
Date
|
DOY
|
Location
|
Depth without the black thing (feet)
|
1/18/2011
|
18
|
Floor
|
29.0
|
|
|
Tower
|
34.3
|
|
|
roadside
|
38.0
|
Vaira_Grass Site
- Fence and gate power: 12 v.
- Panel and Batteries: - v;
- amps; - amps.
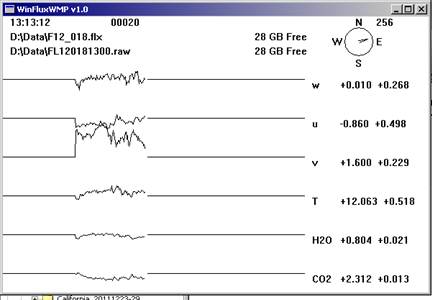
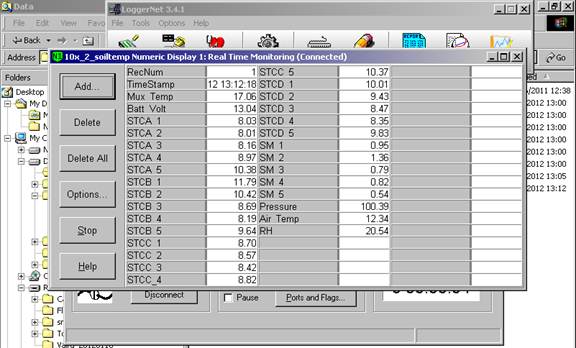
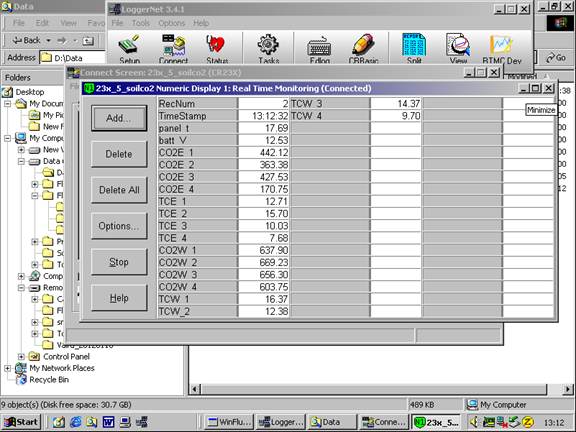
- Reading from Gillsonic screen before downloading data.
(The value of H2O and CO2 should be in the range of
0 ? 5 v.) YES! (forgot downloading the screen prints. Numbers were
within reasonable ranges.)
- downloading data YES!
- Check the fans of air temp. and relative humidity sensors
at Vaira. YES!
- Check MD-9 system connections YES!
- Check levels of Radiation sensors, clear up surfaces.YES!
- Check rain gage, make sure not clogged. YES!
- Closed gate and set up fence. YES!
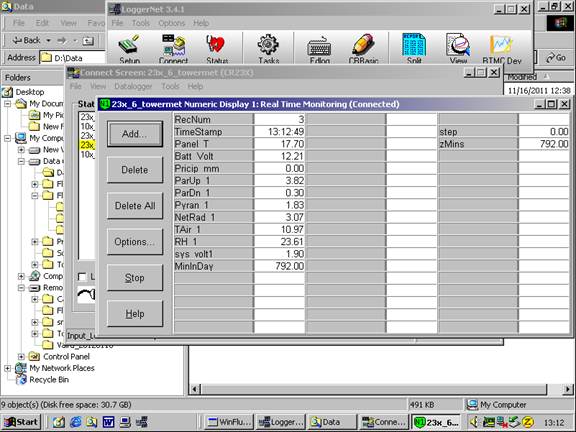
Tonzi_Tower Site
- Fence and gate power: 12 v.
- Panel and Batteries: - v;
- amps; - amps.
- Reading from Gillsonic screen before downloading data.
(The value of H2O and CO2 should be in the range of
0 ? 5 v.) YES! (forgot downloading the screen prints. Numbers were
within reasonable ranges.)
- downloading data YES!
- check the fans of air temp. and relative humidity sensors
on the tower and the floor. YES!
- Check rain gage, make sure not clogged. YES!
- tried installing Li-820 back to the CO2 profile system
but failed; found disconnection of the black power wire. The problem has
been reported to Joe, and he will go to the field soon.
- close gate and set up fence. YES!
Toniz_Floor Site
- Fence and gate power: 12
v.
- Panel and Batteries: - v;
- amps; - amps. (about 7:00 am local time)
- Reading from Gillsonic screen before downloading data.
(The value of H2O and CO2 should be in the range of
0 ? 5 v.)
- downloading data YES!
- Check MD-9 system connections YES!
- Close gate and set up fence. YES!
tonzi
|
7931AFE
|
402165
|
574B4B
|
402FF3
|
574632
|
7A432E
|
7A3C6E
|
7A3B40
|
7A4AAA
|
1/18/2012
|
18
|
|
|
|
|
|
|
|
|
|
sm
|
|
|
|
|
|
|
|
|
0-15
|
11.8
|
10.5
|
#DIV/0!
|
8.2
|
13.4
|
2.9
|
11.5
|
2.7
|
5.0
|
15-30
|
14.1
|
10.5
|
27.1
|
14.4
|
15.2
|
13.5
|
17.6
|
15.2
|
4.7
|
30-45
|
19.8
|
11.4
|
11.1
|
14.2
|
13.6
|
9.9
|
15.1
|
17.2
|
13.8
|
45-60
|
#DIV/0!
|
3.8
|
14.7
|
11.5
|
13.6
|
11.2
|
13.1
|
21.4
|
10.6
|
|
|
|
|
|
|
|
|
|
|
|
A6D882B
|
A3D04E8
|
A6D72F5
|
|
|
|
|
|
|
|
|
|
|
|
|
|
|
|
|
0-15
|
13.0
|
6.8
|
4.2
|
|
|
|
|
|
|
15-30
|
12.6
|
2.8
|
14.2
|
|
|
|
|
|
|
30-45
|
18.0
|
16.7
|
14.7
|
|
|
|
|
|
|
45-60
|
15.1
|
17.5
|
9.5
|
|
|
|
|
|
|
|
|
|
|
|
|
|
|
|
|
vaira
|
57318a
|
7933dee
|
00000128B97F3
|
00000128B8072
|
00000128BDDE8
|
|
|
|
0-15
|
broken
|
2.0
|
7.85
|
1.8
|
1.95
|
|
|
|
|
15-30
|
broken
|
12.9
|
10.15
|
5.1
|
9.2
|
|
|
|
|
30-45
|
broken
|
16.8
|
4.35
|
9.4
|
15.65
|
|
|
|
|
45-60
|
broken
|
26.7
|
14.75
|
9.5
|
15.6
|
|
|
|
|
|
|
|
|
|
|
|
|
|
|
Tonzi
|
|
|
|
|
|
Dendrometer
|
|
|
|
|
|
|
|
|
|
|
Date
|
Day
|
Tag
#
|
Reading (mm)
|
|
|
1/18/2012
|
18
|
72
|
6.0
|
|
|
|
|
79
|
6.0
|
|
|
|
|
102
|
7.6
|
|
|
|
|
245
|
19.3
|
|
|
|
|
250
|
X
|
(reset to 10.5 on May 7, 2009)
|
|
|
|
1
|
17.0
|
|
|
|
|
2
|
14.5
|
|
|
|
|
3
|
12.6
|
|
|
|
|
4
|
19.0
|
|
|
|
|
5
|
23.6
|
|
|
|
|
7
|
6.0
|
133
|
|
|
|
8
|
14.0
|
11828
|
|
|
|
71
|
X
|
|
|
|
|
77
|
X
|
|
|
|
|
78
|
X
|
|
|
|
|
248
|
X
|
broken
|
|
|
|
255
|
X
|
|
|
|
|
252
|
X
|
|
|
|
|
6
|
X
|
|
|
Notes: ?X? means not working any more.
|
Field Data
No tank data
Well Depth
| Date | Location | Depth (feet) |
|---|
| 2012-01-18 | TZ_floor | 29 |
| 2012-01-18 | TZ_road | 38 |
| 2012-01-18 | TZ_tower | 34.3 |
No TZ Moisture Point data found
No VR Moisture Point data found
No TZ grass heigth found
No VR grass heigth found
Tree DBH
| Date | Tag# | Reading (mm) |
|---|
| 2012-01-18 | 1 | 17 |
| 2012-01-18 | 102 | 7.6 |
| 2012-01-18 | 2 | 14.5 |
| 2012-01-18 | 245 | 19.3 |
| 2012-01-18 | 3 | 12.6 |
| 2012-01-18 | 4 | 19 |
| 2012-01-18 | 5 | 23.6 |
| 2012-01-18 | 7 | 6 |
| 2012-01-18 | 72 | 6 |
| 2012-01-18 | 79 | 6 |
| 2012-01-18 | 8 | 14 |
No water potential data found
No TZ Grass Biomass data found
No TZ OakLeaves Biomass data found
No TZ PineNeedles Biomass data found
0 photos found
16 sets found
No data found for TZ_Fenergy.
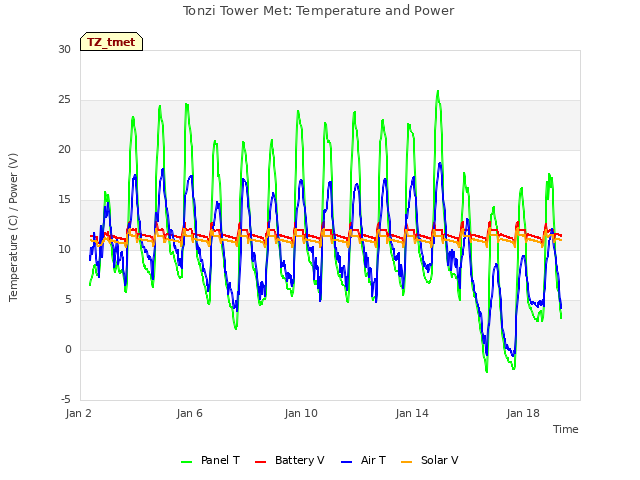
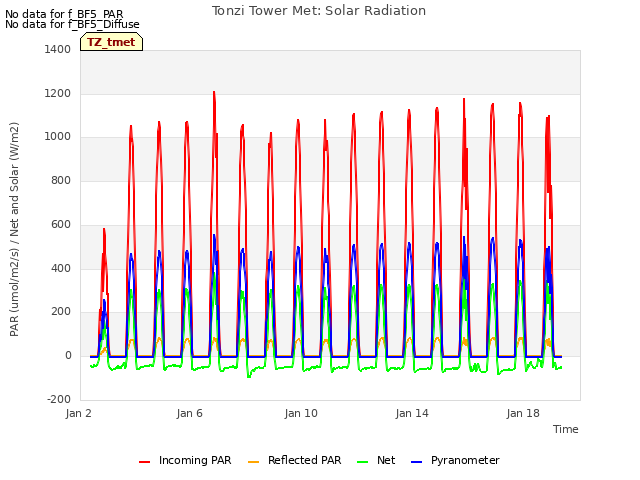
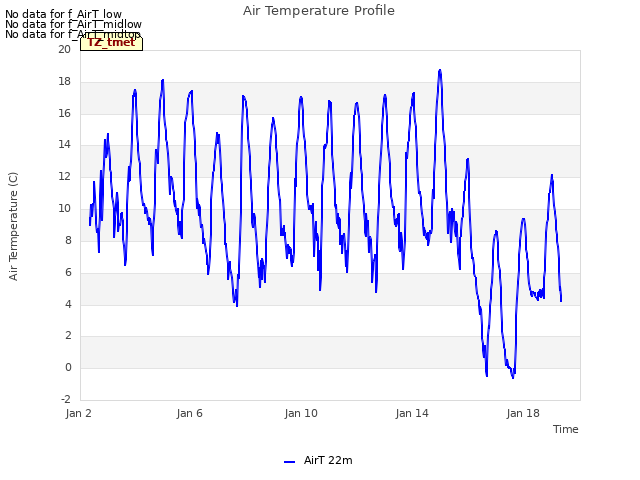
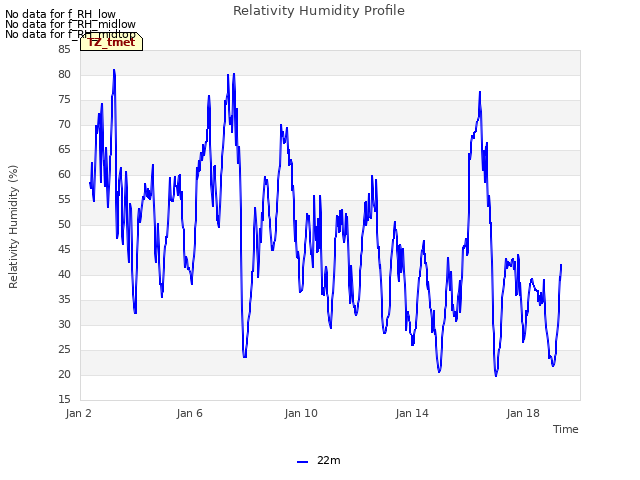
11 TZ_tmet graphs found


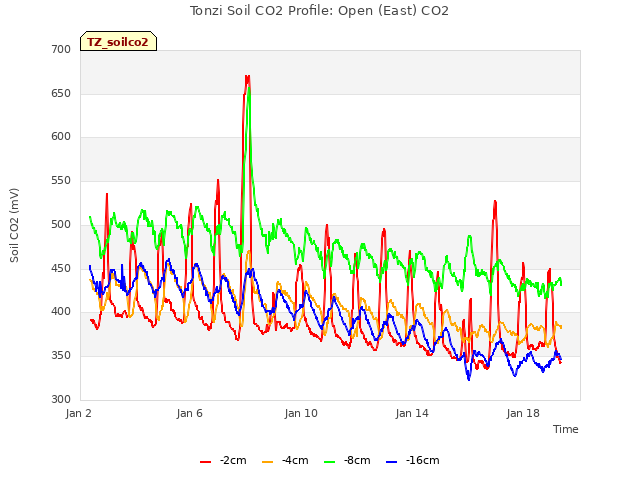
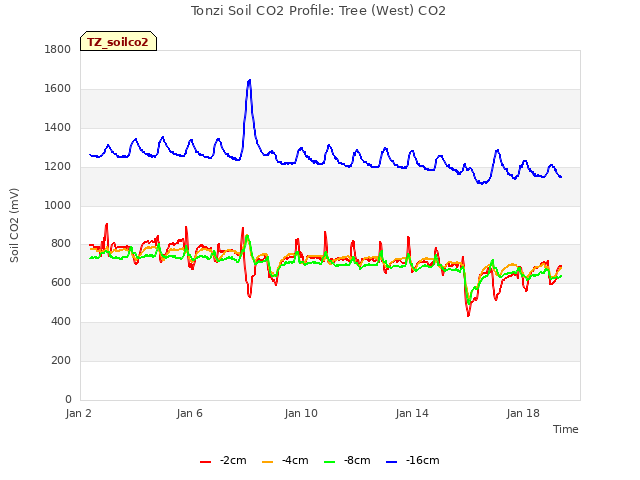
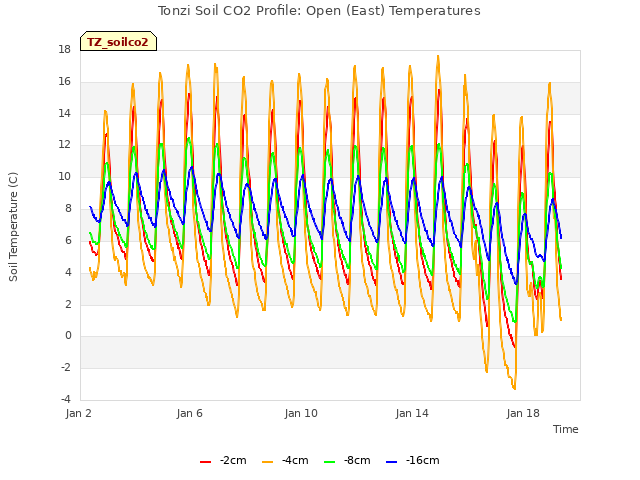
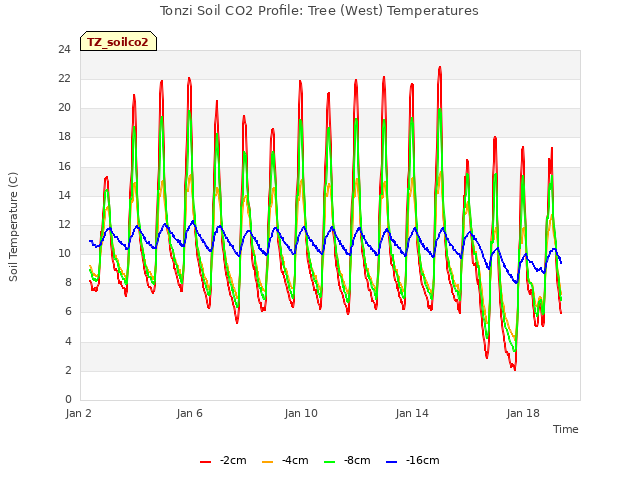
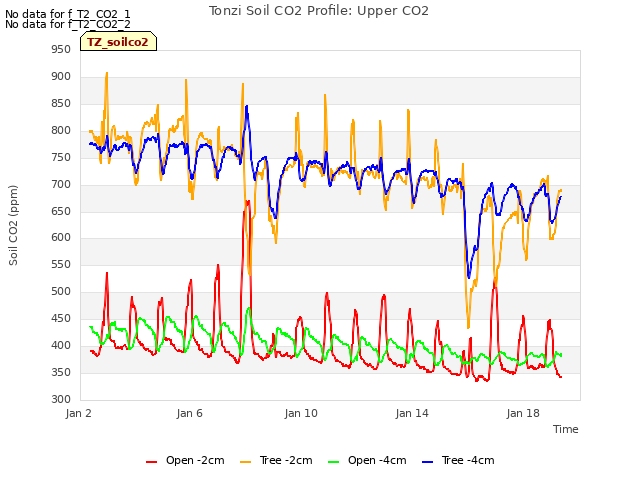
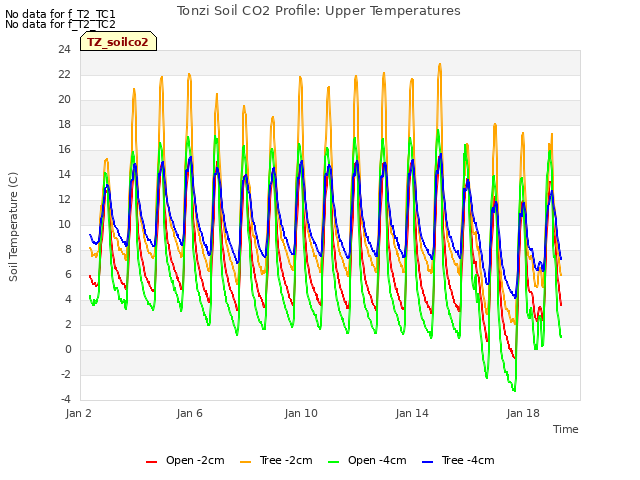
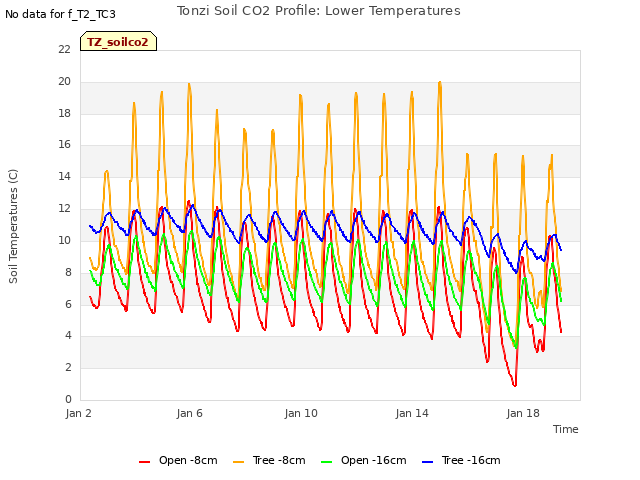
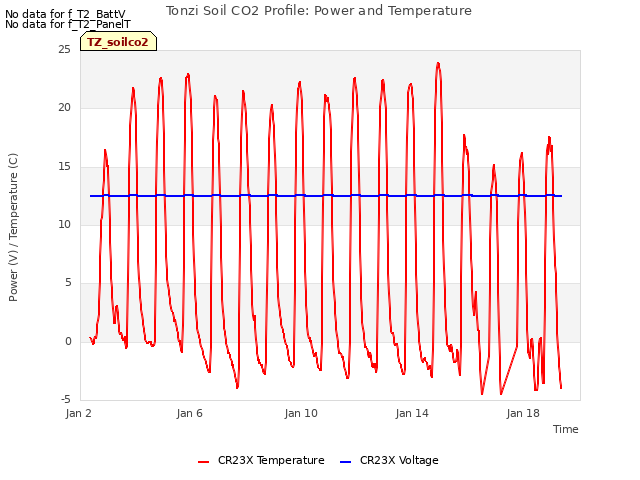
11 TZ_soilco2 graphs found


Can't check TZ_mixed
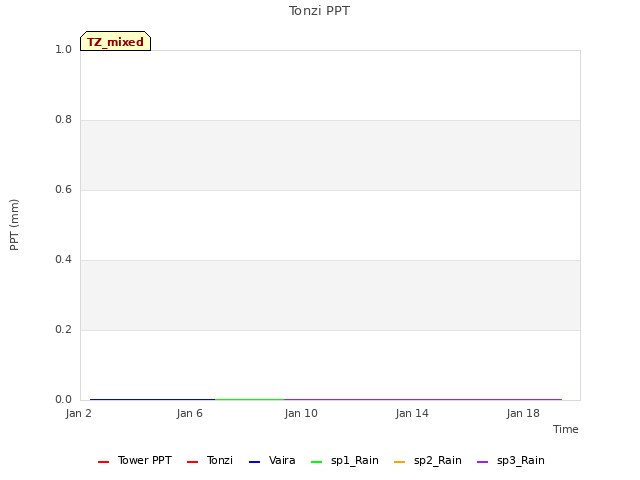
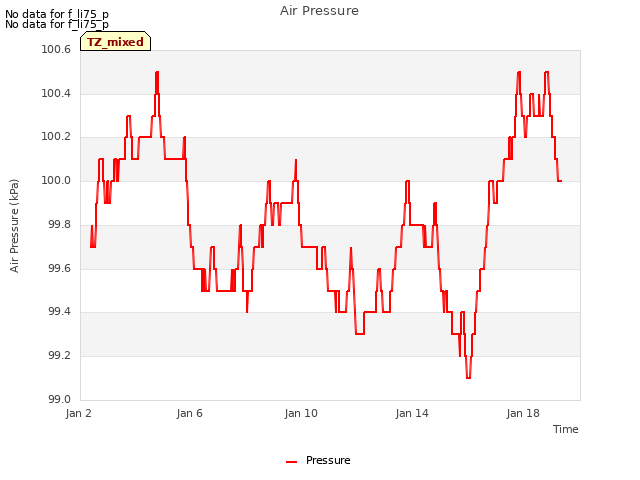
3 TZ_mixed graphs found

1 TZ_fflux graphs found

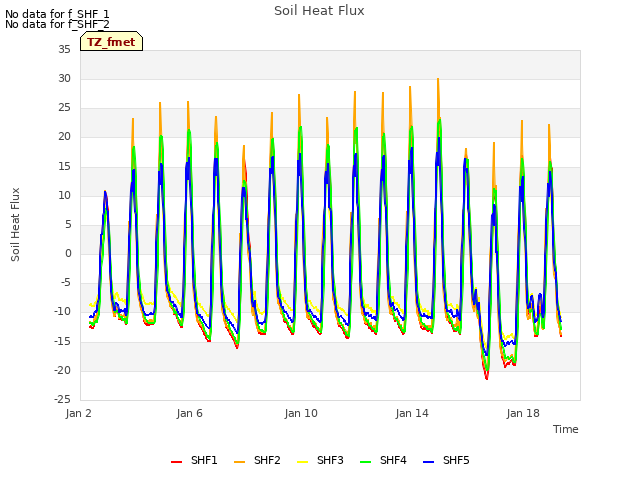
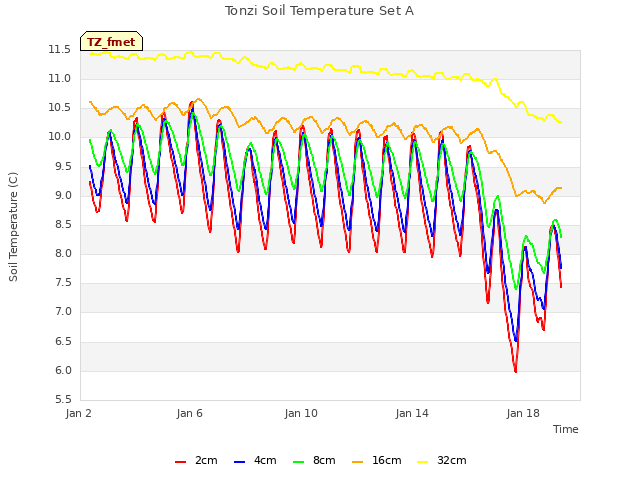
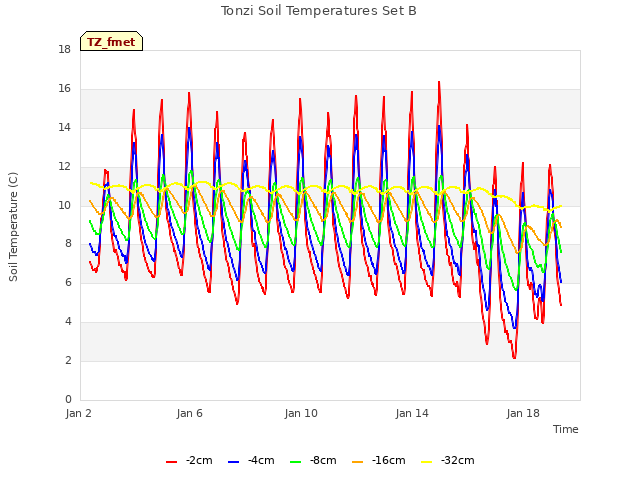
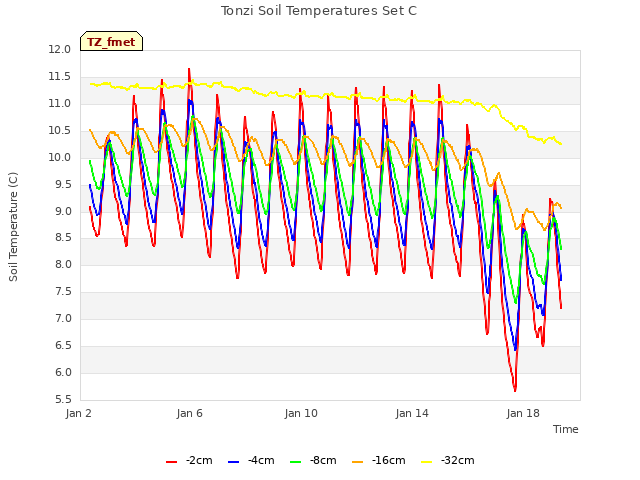
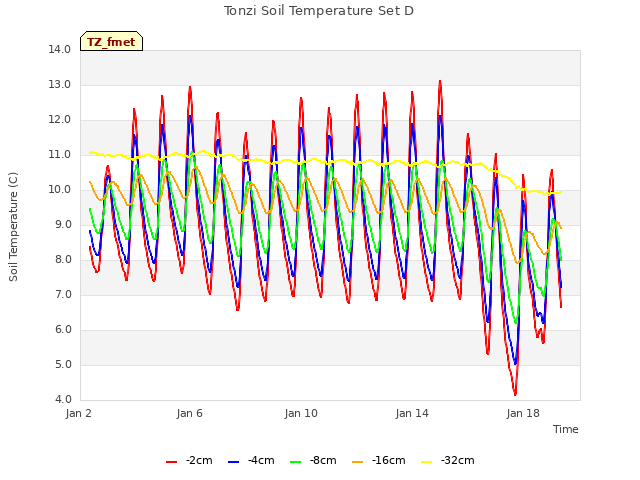
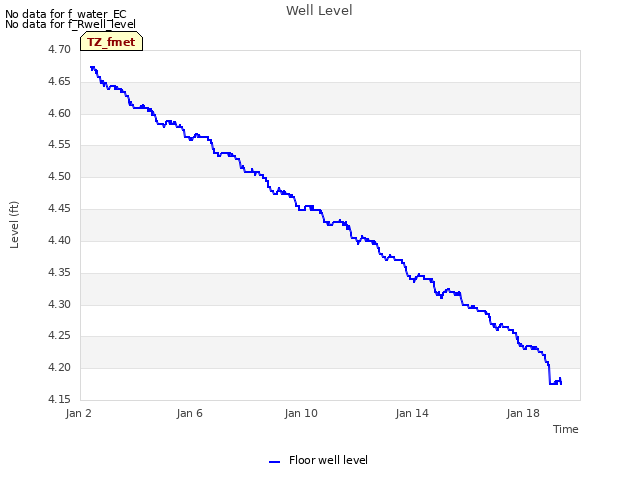
8 TZ_fmet graphs found


No data found for TZ_tram.
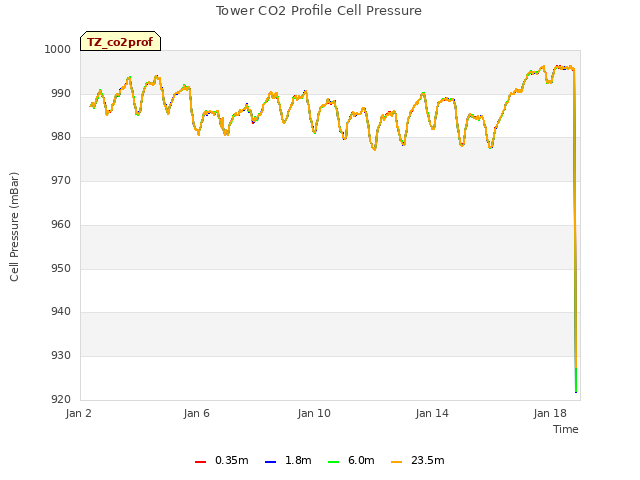
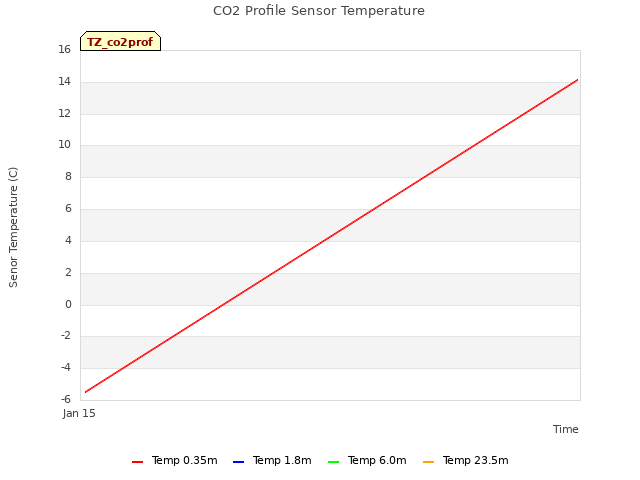
3 TZ_co2prof graphs found
No data found for TZ_irt.
No data found for TZ_windprof.
1 TZ_tflux graphs found

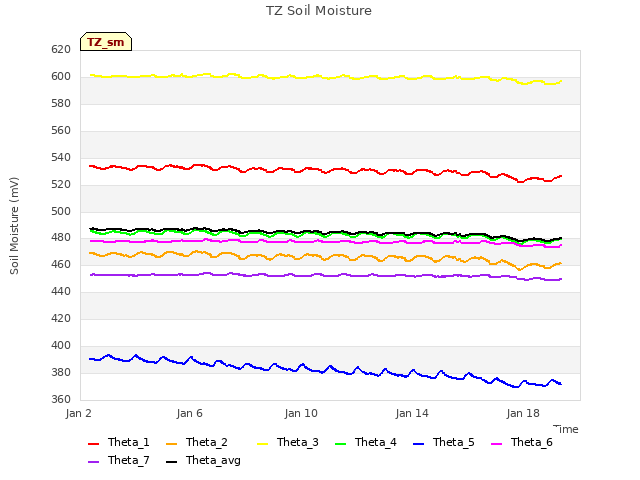
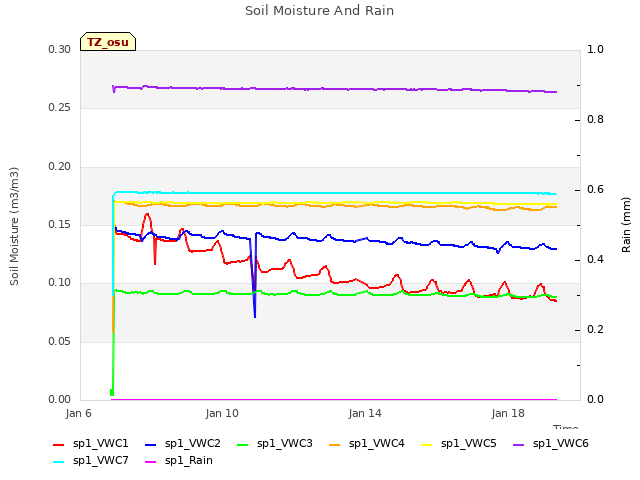
2 TZ_sm graphs found

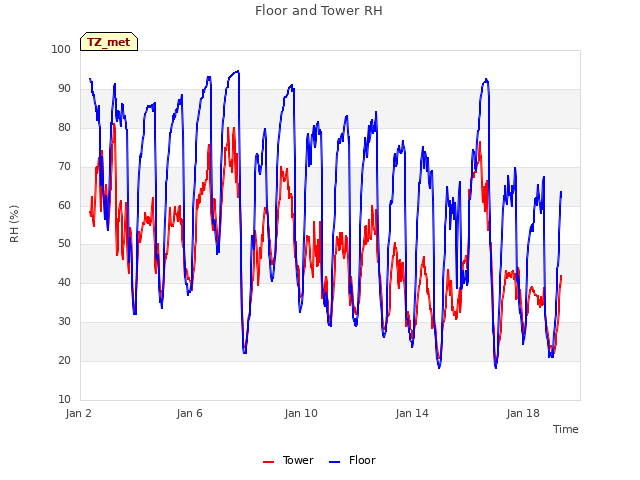
Can't check TZ_met
1 TZ_met graphs found
Can't check TZVR_mixed
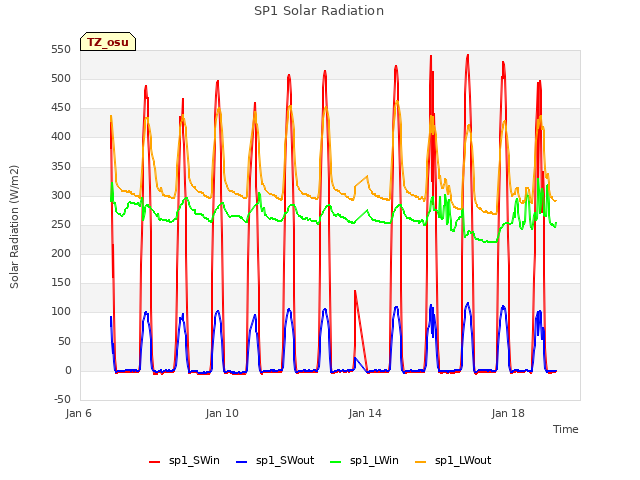
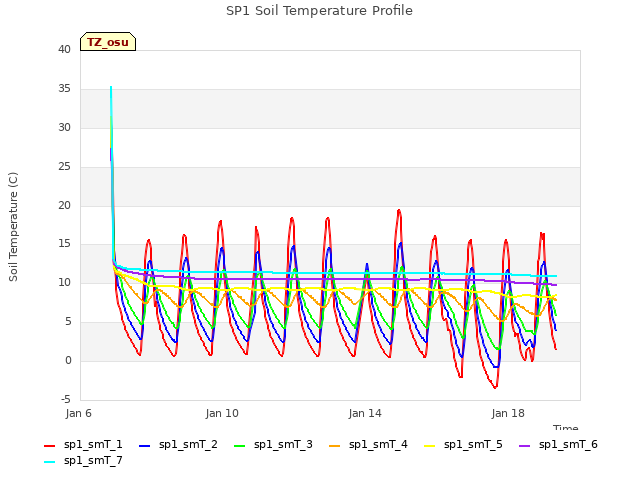
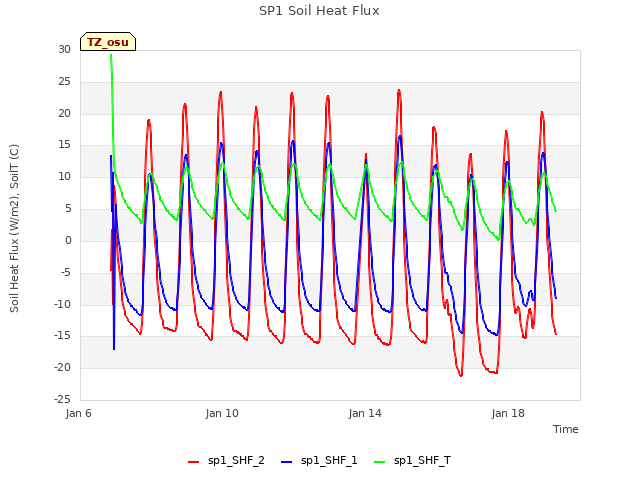
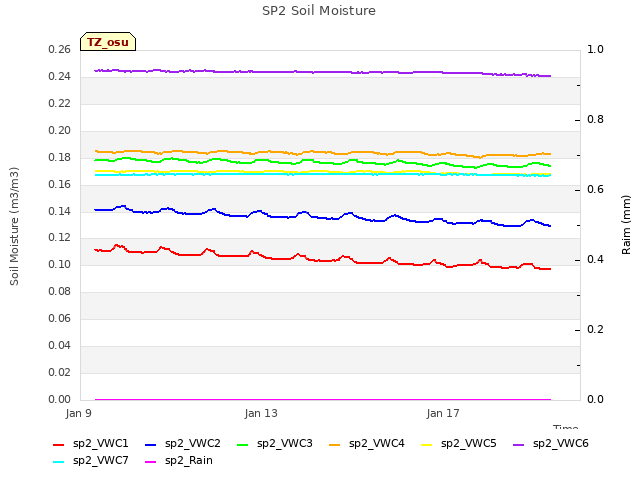
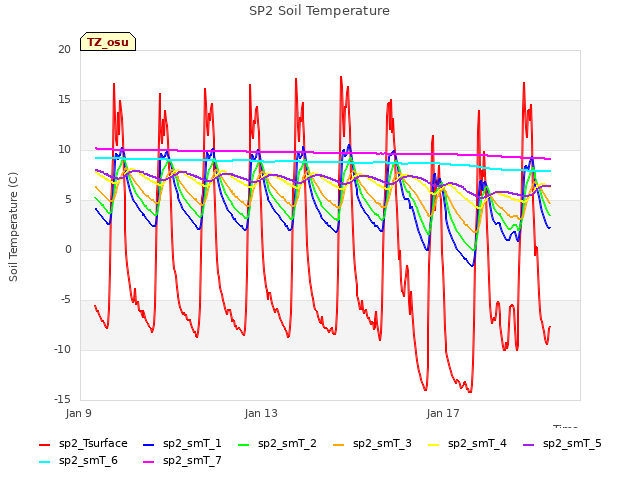
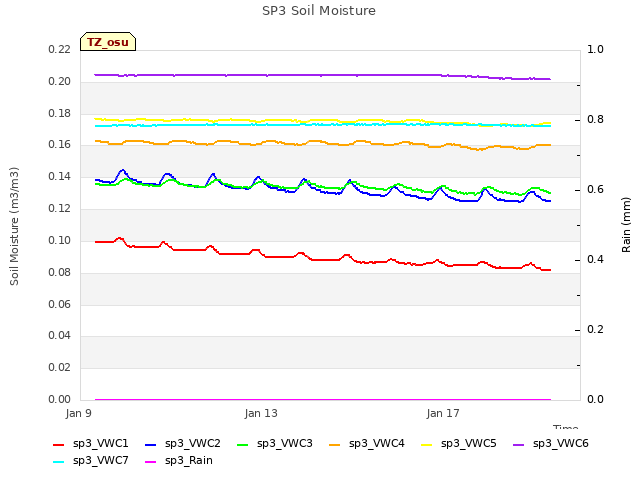
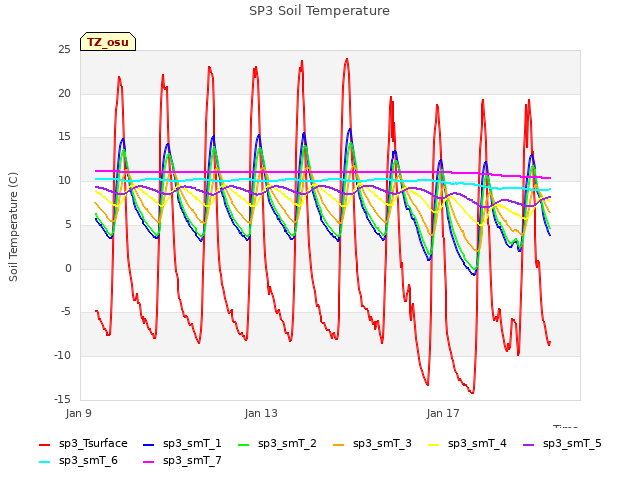
8 TZ_osu graphs found
No data found for TZ_fd.
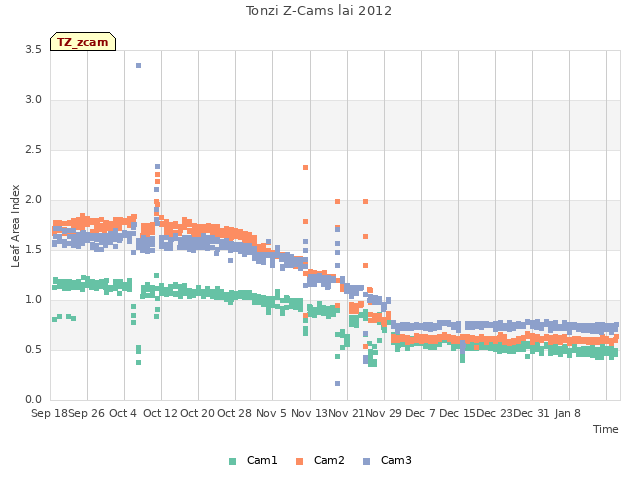
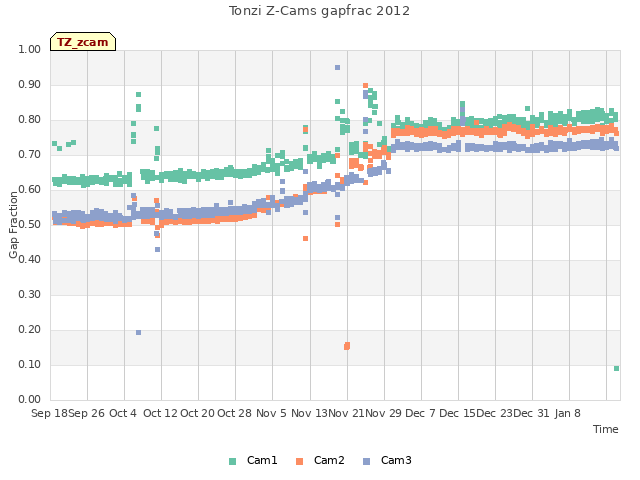
Tonzi Z-cam data