
Field Notes
<--2011-12-18 00:00:00 | 2012-01-06 09:00:00-->Phenocam link: Searching...
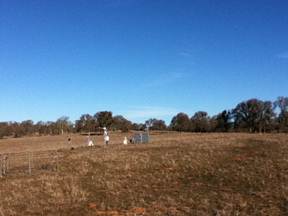
Tonzi: 2012-01-04 09:30:00 (DOY 4)
Author: Siyan Ma
Others:
Summary: Grasses look stressed by dryness, bird droppings on Tonzi Tower 7500, tower hmp45 fan dead, tram not moving.
|
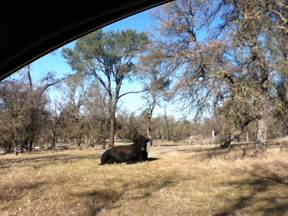
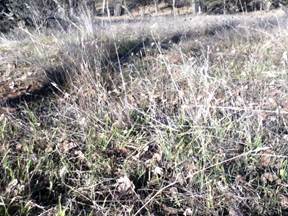
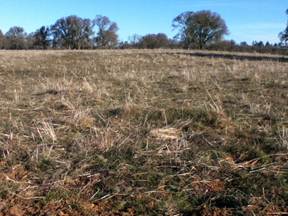
Pond When: Date: 1/4/2012 , Day: 4 , Watch Time: 9:30 am . Where: Tonzi/Vaira Ranch Who: Siyan Weather: clear, perfect temperature for outdoor. Saw Mr. Tonzi. Phenology: grass experiences a dry winter; ~30% grass leaves turned into yellow due to the drought; grasses at Vaira looked stronger and showed dark red color on the edges, probably due to the drought too.
Problems:
Summary
Vaira_Grass Site
Tonzi_Tower Site
Bird craps on the Li-7500 at the Tonzi tower again. 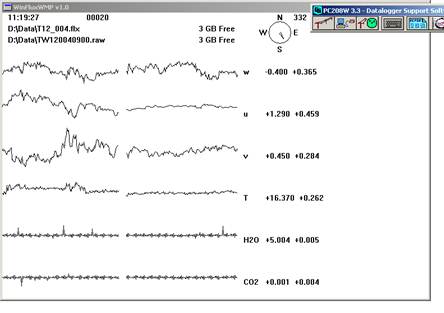
After cleaning-up: 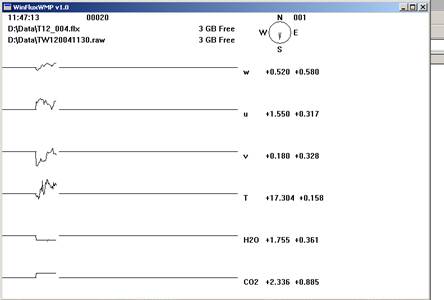
Toniz_Floor Site
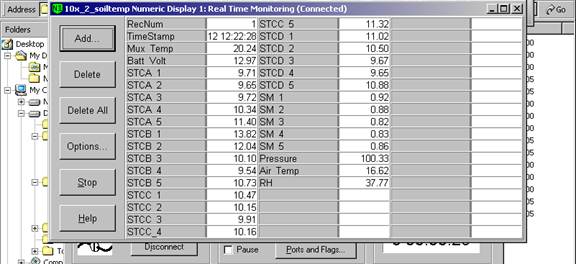
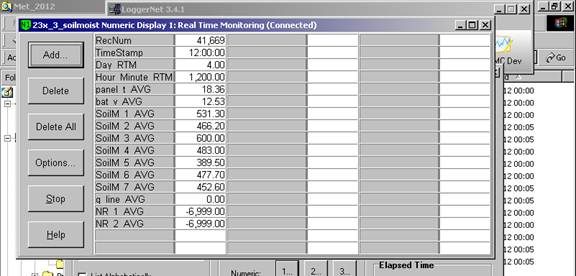
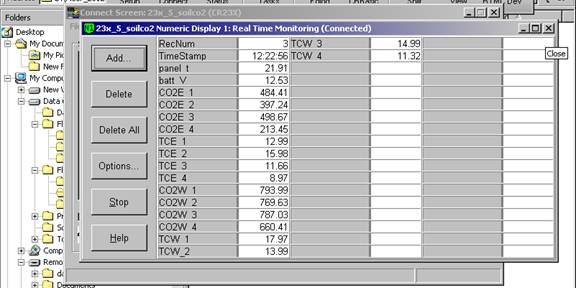
CR10X2 – floor-Met CR23X3 – floor-Met CR23X5 – soil CO2 profile CR23X6 – tower-Met 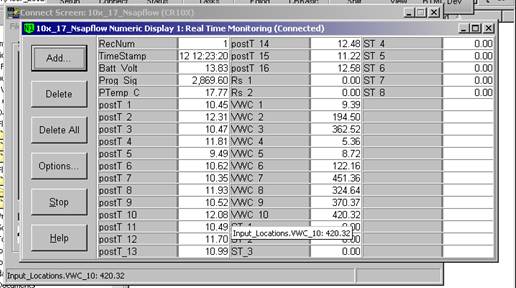
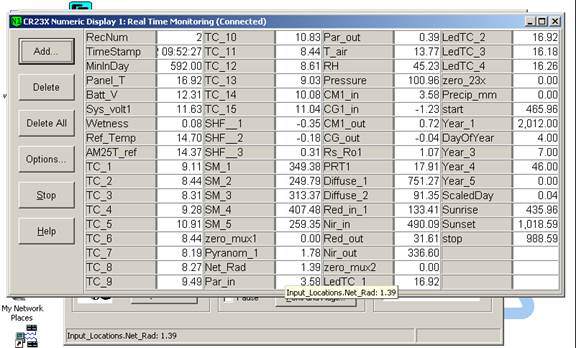
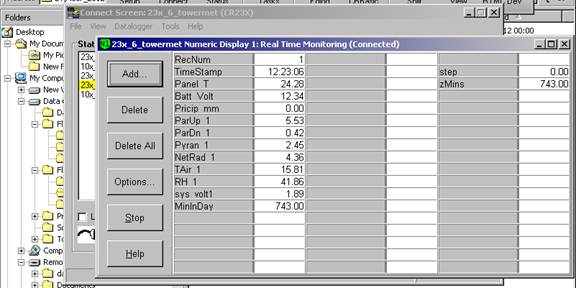
Reading from panels of analyzers
Notes: “X” means not working any more. Dendrometers installed by Gretchen group | ||||||||||||||||||||||||||||||||||||||||||||||||||||||||||||||||||||||||||||||||||||||||||||||||||||||||||||||||||||||||||||||||||||||||||||||||||||||||||||||||||||||||||||||||||||||||||||||||||||||||||||||||||||||||||||||||||||||||||||||||||||||||||||||||||||||||||||||||||||||||||||||||||||||||||||||||||||||||||||||||||||||||||||||||||||||||||||||||||||||||||||||||||||||||||||||||||||||||
Field Data
No tank data
Well Depth
| Date | Location | Depth (feet) |
|---|---|---|
| 2012-01-04 | TZ_floor | 28.5 |
| 2012-01-04 | TZ_road | 37.6 |
| 2012-01-04 | TZ_tower | 33.6 |
No TZ Moisture Point data found
No VR Moisture Point data found
No TZ grass heigth found
No VR grass heigth found
Tree DBH
| Date | Tag# | Reading (mm) |
|---|---|---|
| 2012-01-04 | 1 | 17 |
| 2012-01-04 | 102 | 7.6 |
| 2012-01-04 | 2 | 14.6 |
| 2012-01-04 | 245 | 19.5 |
| 2012-01-04 | 3 | 12.9 |
| 2012-01-04 | 4 | 19 |
| 2012-01-04 | 5 | 23.5 |
| 2012-01-04 | 7 | 14.1 |
| 2012-01-04 | 72 | 6.9 |
| 2012-01-04 | 79 | 6.5 |
| 2012-01-04 | 8 | 6.1 |
No water potential data found
No TZ Grass Biomass data found
No TZ OakLeaves Biomass data found
No TZ PineNeedles Biomass data found
0 photos found
16 sets found
No data found for TZ_Fenergy.
11 TZ_tmet graphs found
11 TZ_soilco2 graphs found
Can't check TZ_mixed
3 TZ_mixed graphs found
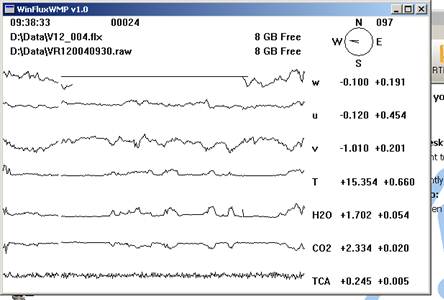
1 TZ_fflux graphs found
8 TZ_fmet graphs found
No data found for TZ_tram.
3 TZ_co2prof graphs found
No data found for TZ_irt.
No data found for TZ_windprof.
1 TZ_tflux graphs found
2 TZ_sm graphs found
Can't check TZ_met
1 TZ_met graphs found
Can't check TZVR_mixed
No data found for TZ_osu.
No data found for TZ_fd.
Tonzi Z-cam data