
Field Notes
<--2011-10-13 11:00:00 | 2011-10-18 09:30:00-->Other sites visited today: Twitchell Rice | Mayberry | Vaira | Tonzi
Phenocam link: Searching...
Tonzi: 2011-10-13 11:00:00 (DOY 286)
Author: Joe Verfaillie
Others: Siyan
Summary: Swapped LI800-820, Walked EMI survey.
| Tonzi
2011-10-13 I arrived about 11:00PST with Siyan. It was clear, sunny and hot with little to no wind. The ground was visibly damp in low spots. Grass has sprouted and is about 5am tall already. The trees still look good and may have postponed the leaf drop that I observed last time. I was going to setup the Stardot camera from Andrew Richarson?s lab, but given the problems I had installing the one at Vaira and being a short on time I postponed this. I checked the CO2 profile system. I could not figure out what was wrong with the LI800. I reset its settings and it stopped being railed at 1000ppm but was reading mostly about zero. I tried to calibrate it, but this did not improve its performance, in fact it said it could not complete the span calibration. So I pulled it out and swapped in the LI820 from the lab. This one seemed to work, though you need to use the LI820 software to talk to it. The LI820 software in the tower PC is version 1 and is not completely compatible with the newest firmware in the LI820. About 2PM PDT, I started an EMI survey. This time I was about to load a way point layer to the GPS so I had some better reference as to where I was supposed to be walking. I finished the survey in about two hours, though it might be a little less dense than Trenton?s, especially south of the road. In some places I could still see tracks from last time. |
Field Data
No tank data
Well Depth
| Date | Location | Depth (feet) |
|---|---|---|
| 2011-10-13 | TZ_floor | 26.1 |
| 2011-10-13 | TZ_road | 35.4 |
| 2011-10-13 | TZ_tower | 30.7 |
No TZ Moisture Point data found
No VR Moisture Point data found
No TZ grass heigth found
No VR grass heigth found
No TZ Tree DBH found
Water Potential - mode: raw
| Time | Species | Tree | readings (bar) | |||||
|---|---|---|---|---|---|---|---|---|
| 2011-10-13 11:52:00 | OAK | UNKNOWN | -29 | -25 | -23 | -28 | -30 | -33 |
| 2011-10-13 11:52:00 | PINE | OLD | -17 | -15 | -15 | |||
| 2011-10-13 11:52:00 | PINE | YNG | -10 | -15 | -2.5 | |||
No TZ Grass Biomass data found
No TZ OakLeaves Biomass data found
No TZ PineNeedles Biomass data found
2 photos found
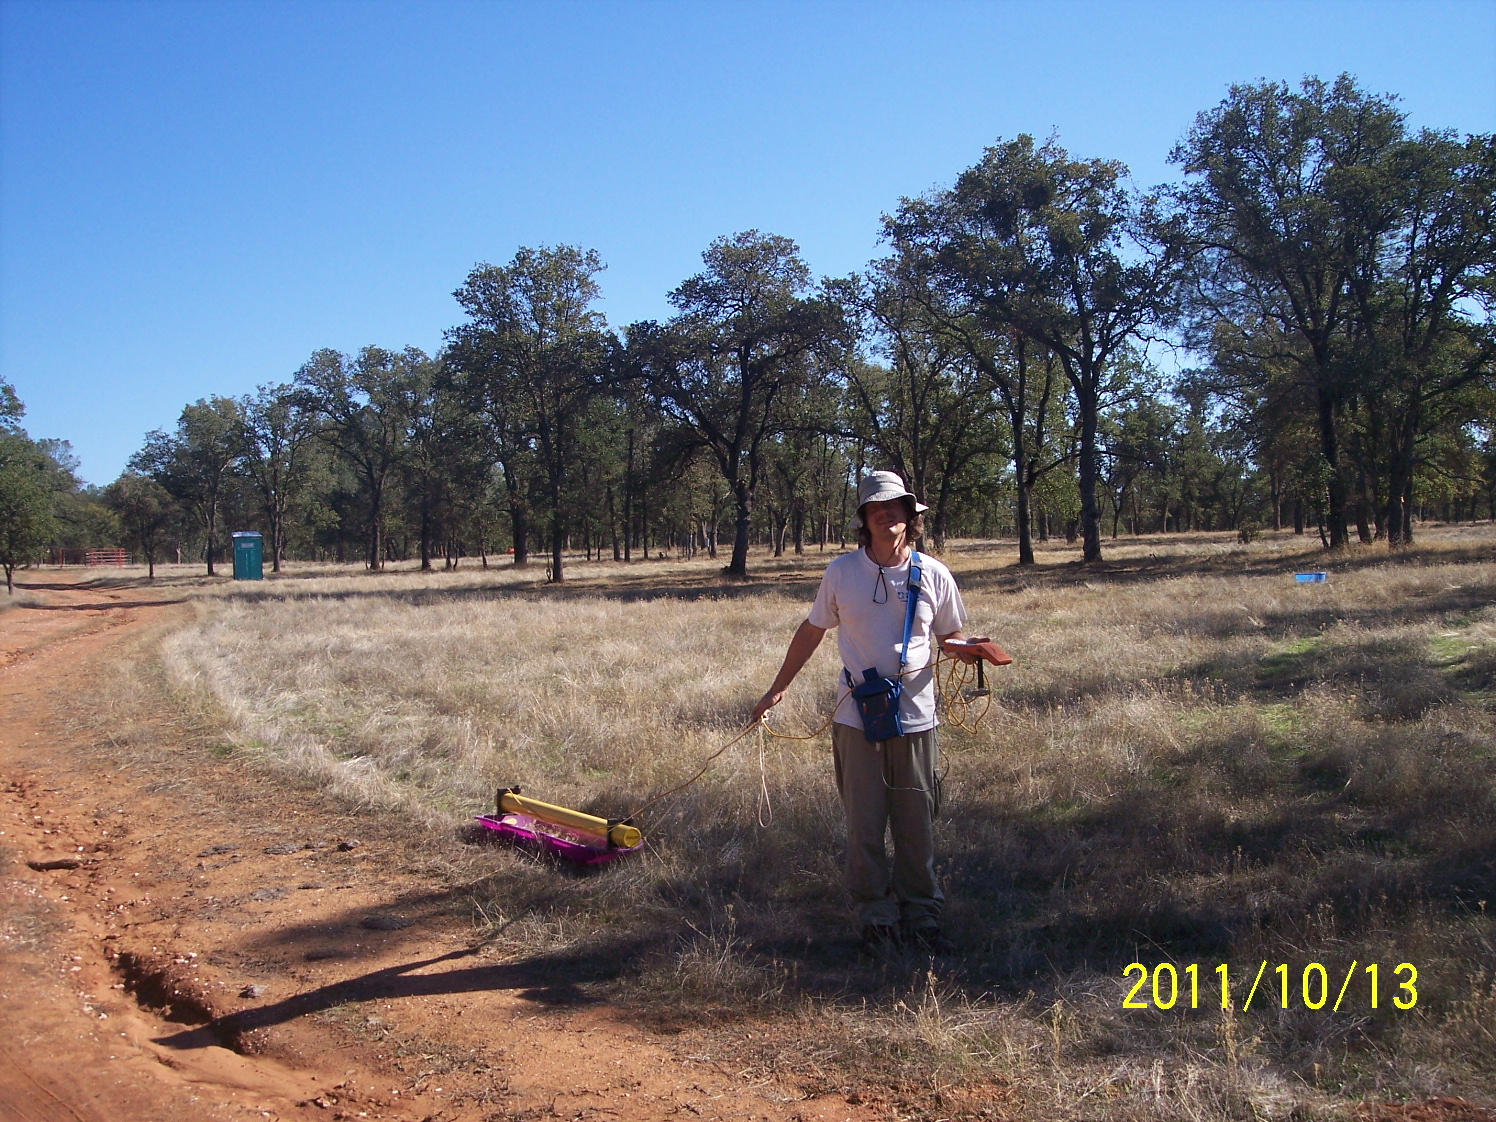
sm20111013TZ_JoeEMI1.jpg ( 2011-10-13 07:09:29 ) Full size: 1496x1122
Joe pulling soil moisture sensor on sled at oak woodland
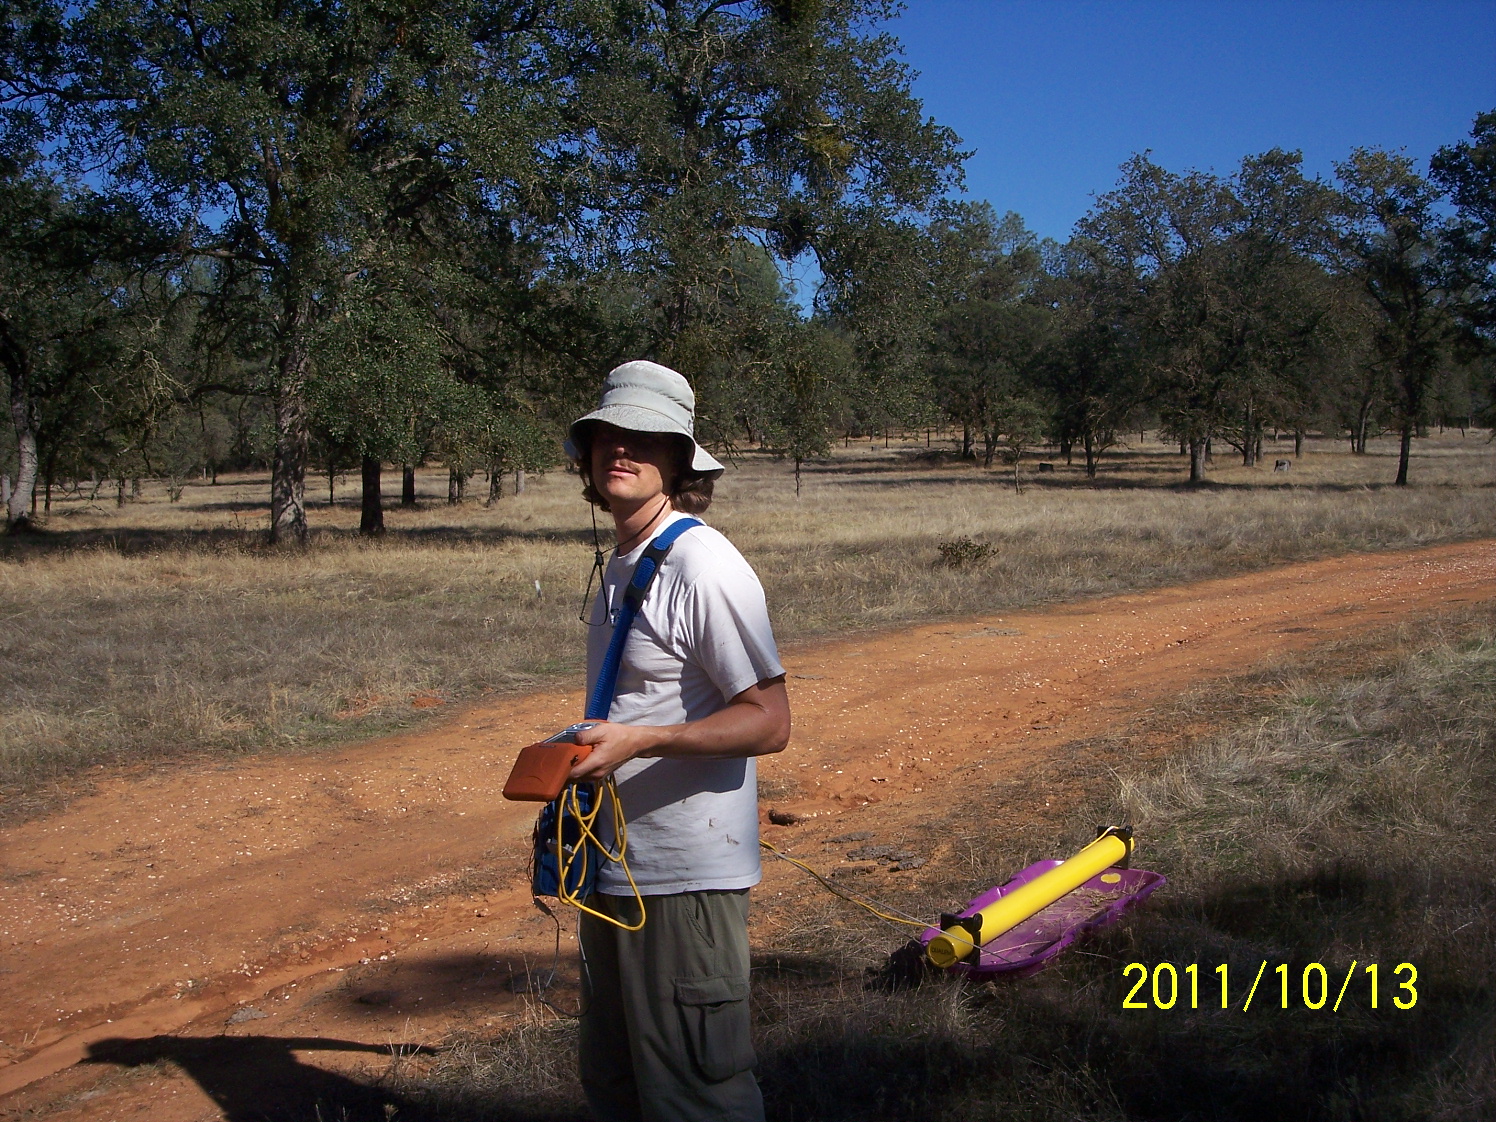
sm20111013TZ_JoeEMI2.jpg ( 2011-10-13 07:09:48 ) Full size: 1496x1122
Joe pulling soil moisture sensor on sled at oak woodland
16 sets found
No data found for TZ_Fenergy.
11 TZ_tmet graphs found
11 TZ_soilco2 graphs found
Can't check TZ_mixed
3 TZ_mixed graphs found
1 TZ_fflux graphs found
8 TZ_fmet graphs found
1 TZ_tram graphs found
3 TZ_co2prof graphs found
No data found for TZ_irt.
No data found for TZ_windprof.
1 TZ_tflux graphs found
2 TZ_sm graphs found
Can't check TZ_met
1 TZ_met graphs found
Can't check TZVR_mixed
No data found for TZ_osu.
No data found for TZ_fd.
Tonzi Z-cam data