Field Notes
<--2011-10-04 09:00:00 | 2011-10-20 08:30:00-->Other sites visited today: Mayberry | Vaira | Tonzi | Tonzi
Phenocam link: Searching...
Twitchell Rice: 2011-10-13 07:30:00 (DOY 286)
Author: Joe Verfaillie
Others: Siyan
Summary: Removed ground sensors and turned radiation boom from the field for Harvest.
| Twitchell
2011-10-13 I arrived about 7:30PST with Siyan. It was warm and clear with little to no wind. There was heavy dew on the grass and rice. We met Jim who said they harvested one load from Field 1 yesterday. UC Davis has pulled their equipment. The LRG was running and the CH4 was near 3.4ppm. The cell pressure was about 119Torr, but I adjusted it back up to about 144Torr with on change in concentration. I pulled the ground sensors and piled them around the base of the tower. When I rotated the radiation boom to the north, I broke the LRG tubing just above the T on the tower. I was able to put a new nut and farrels on it and reconnect it. In the north position the boom wasn?t very level so I tightened the counter balance cable to bring it into a more level position. The CR1000 was not connecting in logger net. Reconnecting the USB adapter didn?t fix it. Restarting Loggernet did. All looked okay. I picked up another LI7500 from Frank for Calibration. |
4 photos found

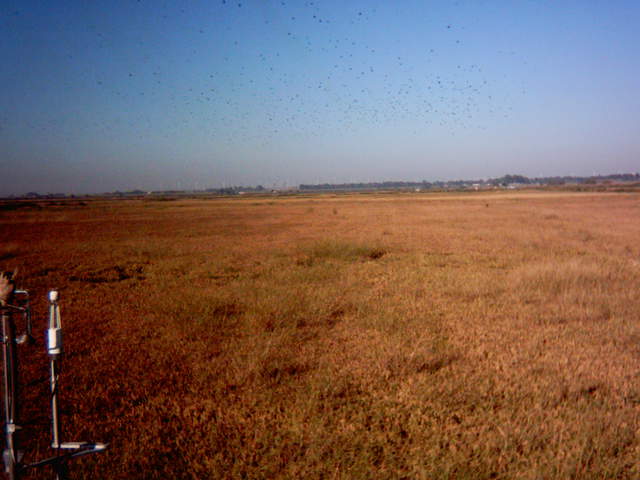
TW_plantcam_20111014_0830.jpg ( 2011-10-14 08:30:00 ) Full size: 2560x1920
Kestrel on tower and birds in the air.

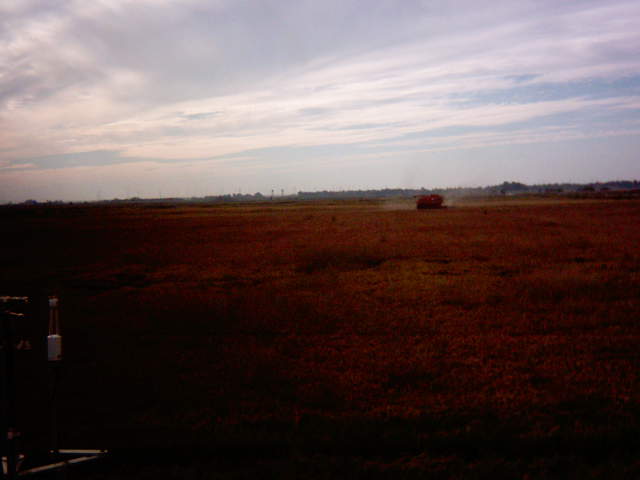
TW_plantcam_20111014_1500.jpg ( 2011-10-14 15:00:00 ) Full size: 2560x1920
Combine in the field.

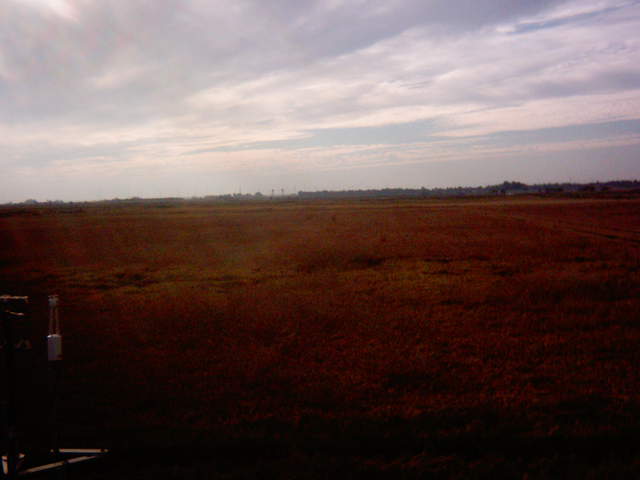
TW_plantcam_20111014_1530.jpg ( 2011-10-14 15:30:00 ) Full size: 2560x1920
Harvest.

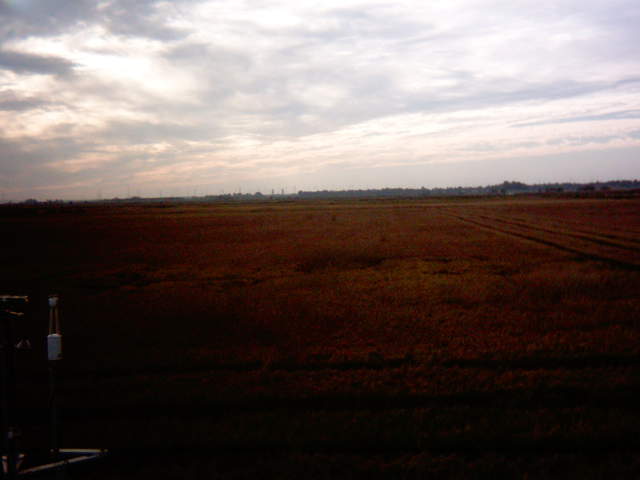
TW_plantcam_20111014_1600.jpg ( 2011-10-14 16:00:00 ) Full size: 2560x1920
Harvest.
6 sets found
12 TW_met graphs found
5 TW_flux graphs found
Can't check TWSI_mixed
Can't check SIMBTWEE_met
1 TW_cam graphs found
Can't check TATWBABCSB_cam

