
Field Notes
<--2011-10-13 11:00:00 | 2011-10-18 09:30:00-->Other sites visited today: Twitchell Rice | Mayberry | Vaira | Tonzi
Phenocam link: Searching...
Tonzi: 2011-10-13 11:00:00 (DOY 286)
Author: Siyan Ma
Others: Joe
Summary: Grass is up, Vaira 7500 down and swapped with Frank's, Stardot camera added to Vaira, swapped co2 profile IRGA, EMI survey.
|
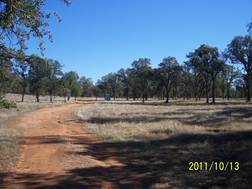
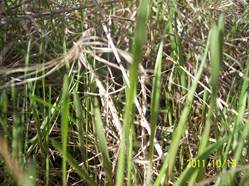
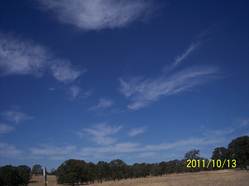
Pond When: Date: 10/13/2011 , Day: 286 , Watch Time: 11:00 am Where: Tonzi/Vaira Ranch Who: Siyan, Joe Weather: hot, nice breeze Phenology: grass has germinated, ~3 cm high; green oak leaves
Summary
Vaira_Grass Site
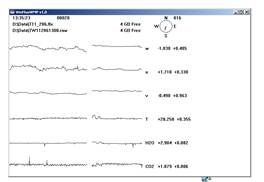
Li-7500 at Vaira was dead when we got there. Swapped with Frank?s set for short time. Joe will swap a new next Tue. (Notice: Frank?s set: range of H2O: 0-1000; CO2: 5-25, should be 10-25. ). 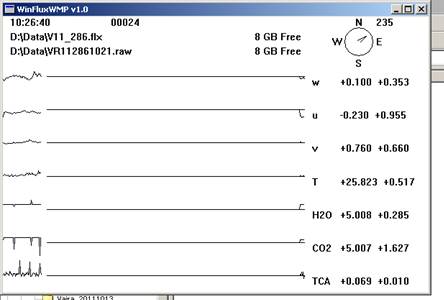
Tonzi_Tower Site
Joe installed a new CO2 analyzer for the CO2 profile system. Because the Li-800 software could not talk to the new machine, calibrated in the field was not done this time. 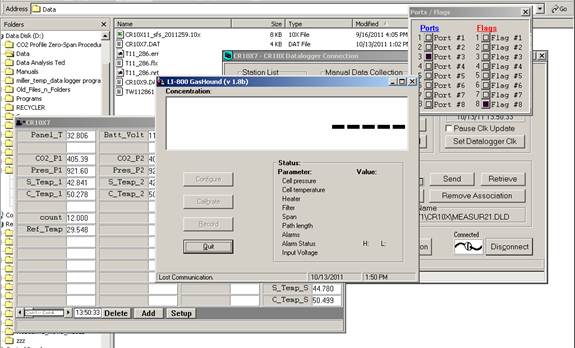
Toniz_Floor Site
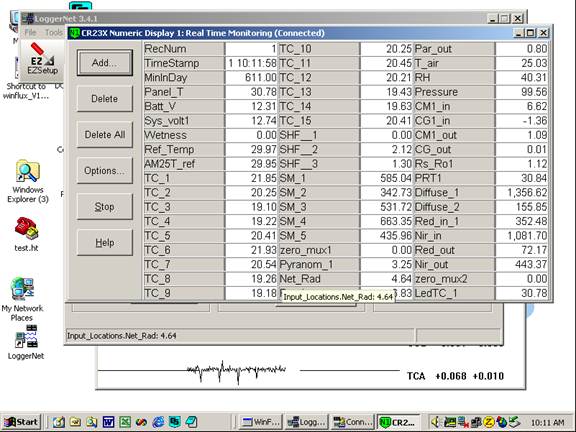
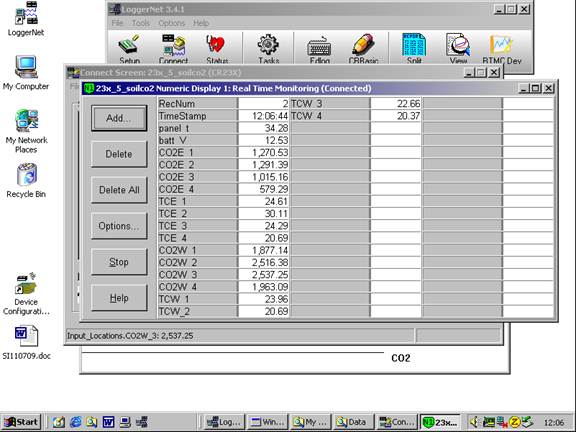
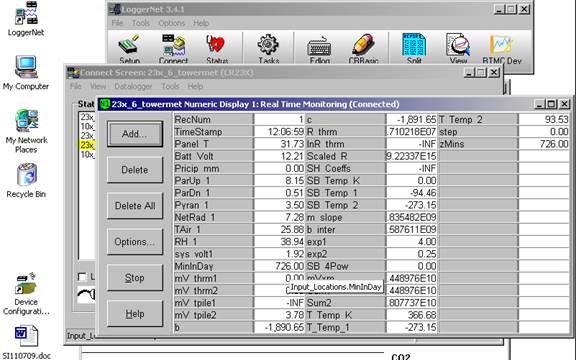
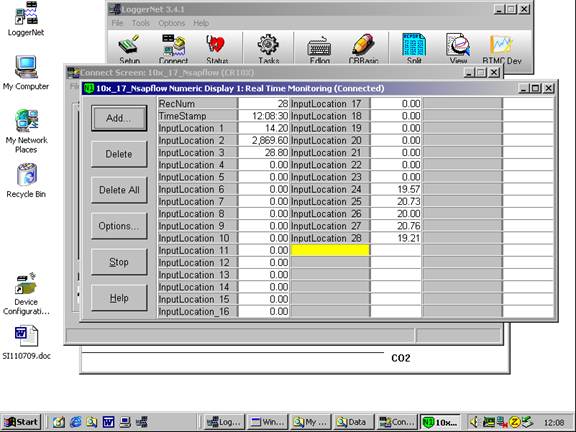
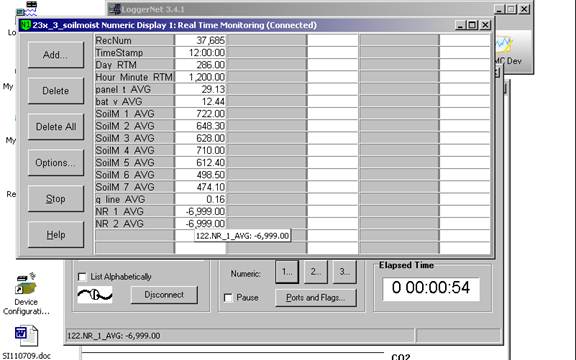
CR23X3 ? floor-Met CR23X5 ? soil CO2 profile CR23X6 ? tower-Met CR10X2 ? floor-Met 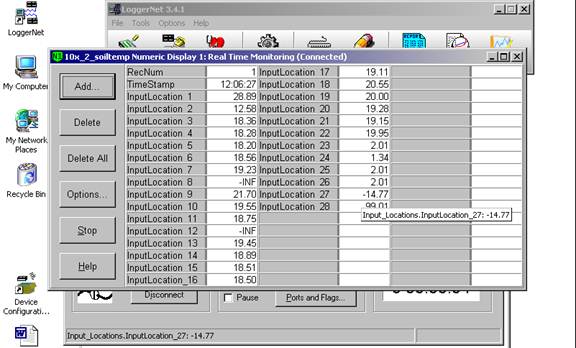
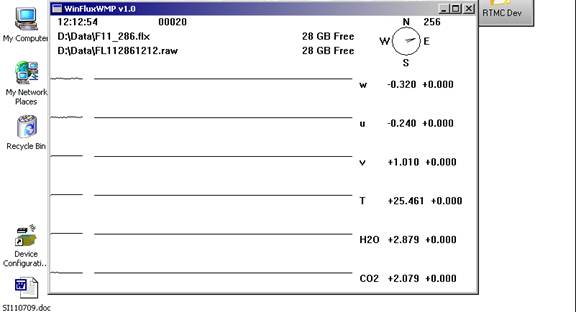
Reading from panels of analyzers
Notes: ?X? means not working any more. Dendrometers installed by Gretchen group 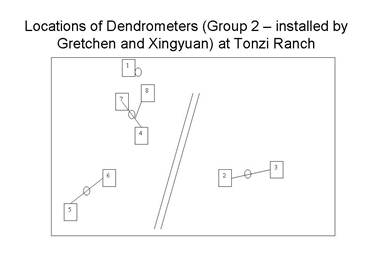 | ||||||||||||||||||||||||||||||||||||||||||||||||||||||||||||||||||||||||||||||||||||||||||||||||||||||||||||||||||||||||||||||||||||||||||||||||||||||||||||||||||||||||||||||||||||||||||||||||||||||||||||||||||||||||||||||||||||||||||||||||||||||||||||||||||||||||||||||||||||||||||||||||||||||||||||||||||||||||||||||||||||||||||||||||||||||||||||||||||||||||||||||||||||||||||||||||||||||||||

Field Data
No tank data
Well Depth
| Date | Location | Depth (feet) |
|---|---|---|
| 2011-10-13 | TZ_floor | 26.1 |
| 2011-10-13 | TZ_road | 35.4 |
| 2011-10-13 | TZ_tower | 30.7 |
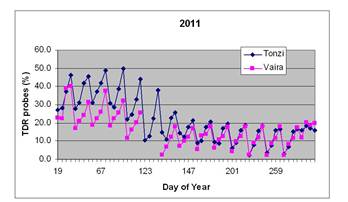
No TZ Moisture Point data found
No VR Moisture Point data found
No TZ grass heigth found
No VR grass heigth found
No TZ Tree DBH found
Water Potential - mode: raw
| Time | Species | Tree | readings (bar) | |||||
|---|---|---|---|---|---|---|---|---|
| 2011-10-13 11:52:00 | OAK | UNKNOWN | -29 | -25 | -23 | -28 | -30 | -33 |
| 2011-10-13 11:52:00 | PINE | OLD | -17 | -15 | -15 | |||
| 2011-10-13 11:52:00 | PINE | YNG | -10 | -15 | -2.5 | |||
No TZ Grass Biomass data found
No TZ OakLeaves Biomass data found
No TZ PineNeedles Biomass data found
2 photos found
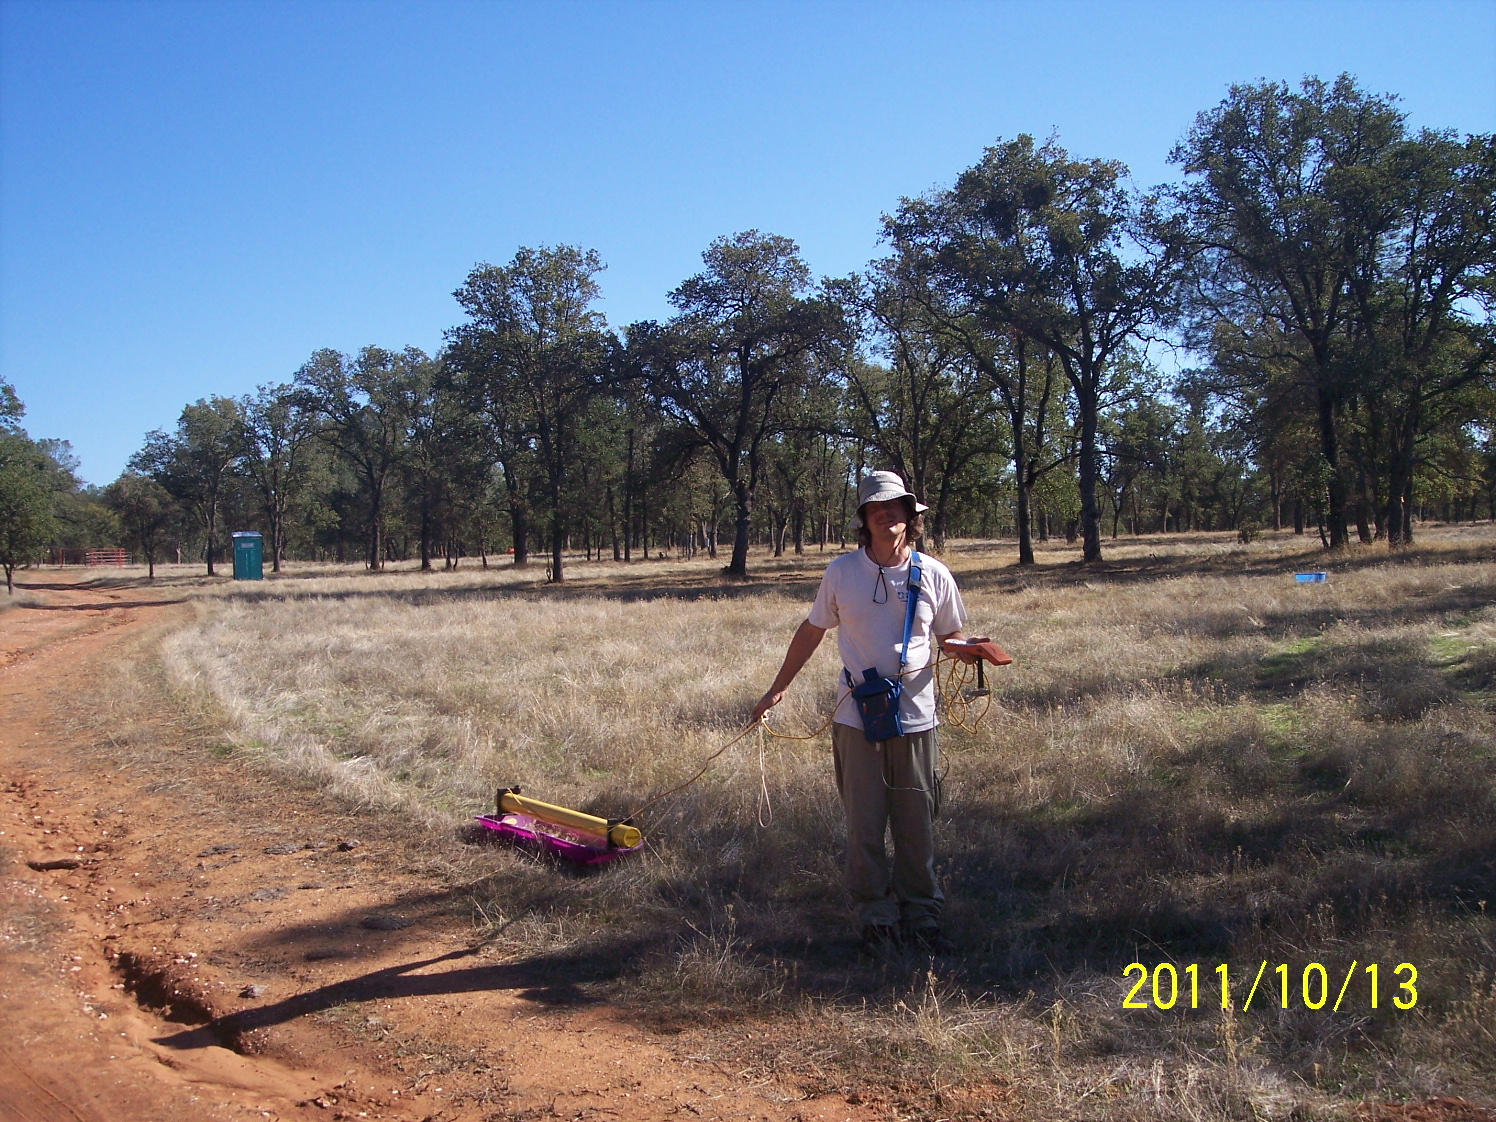
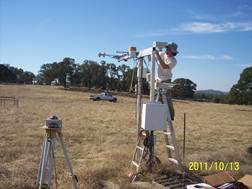
sm20111013TZ_JoeEMI1.jpg ( 2011-10-13 07:09:29 ) Full size: 1496x1122
Joe pulling soil moisture sensor on sled at oak woodland
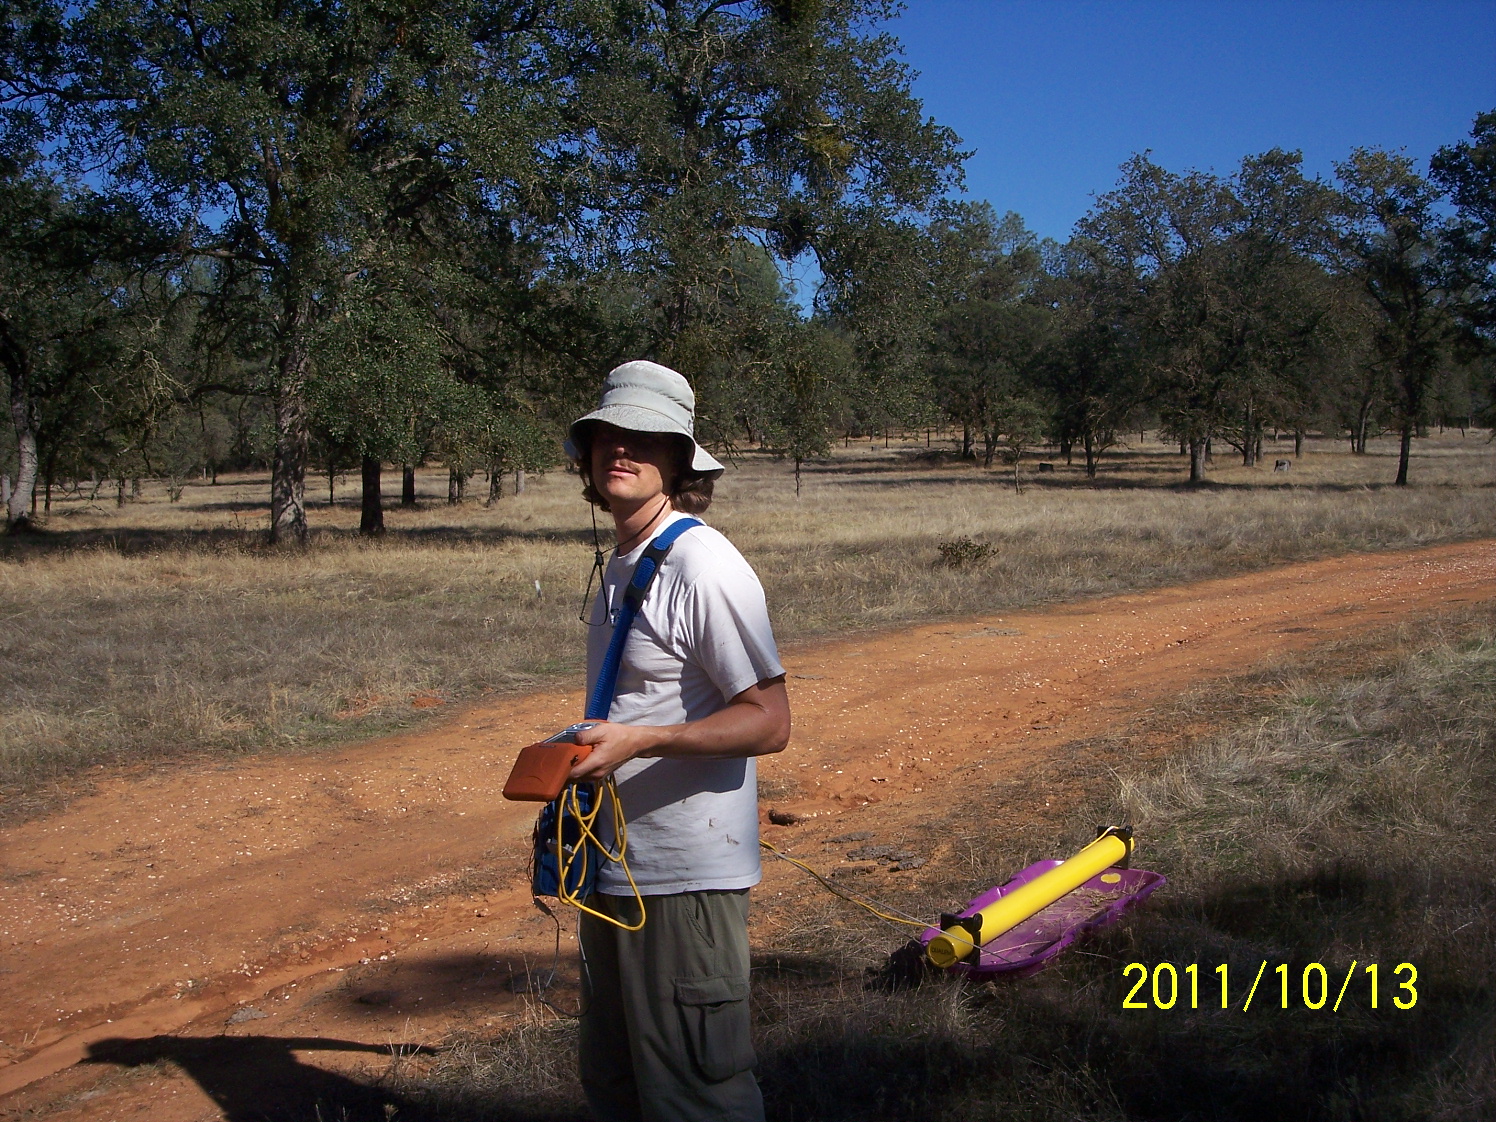
sm20111013TZ_JoeEMI2.jpg ( 2011-10-13 07:09:48 ) Full size: 1496x1122
Joe pulling soil moisture sensor on sled at oak woodland
16 sets found
No data found for TZ_Fenergy.
11 TZ_tmet graphs found
11 TZ_soilco2 graphs found
Can't check TZ_mixed
3 TZ_mixed graphs found
1 TZ_fflux graphs found
8 TZ_fmet graphs found
1 TZ_tram graphs found
3 TZ_co2prof graphs found
No data found for TZ_irt.
No data found for TZ_windprof.
1 TZ_tflux graphs found
2 TZ_sm graphs found
Can't check TZ_met
1 TZ_met graphs found
Can't check TZVR_mixed
No data found for TZ_osu.
No data found for TZ_fd.
Tonzi Z-cam data