Field Notes
<--2023-10-11 13:50:00 | 2023-10-27 13:00:00-->Other sites visited today: Tonzi | Vaira | Hill Slough
Phenocam link: Searching...
West Pond: 2023-10-18 15:45:00 (DOY 291)
Author: Daphne Szutu
Others: Joe
Summary: Quick stop to check power--ok, M4.2 earthquake today
| 2023-10-18 West Pond Joe and I arrived at 15:45 PDT after a day at Tonzi/Vaira. It was warm and hazy with an occasional cool breath of air. It smelled smoky at Tonzi but no smoke smell here. The inlet was on and the staff gauge read 59cm. At the tower, wasps were buzzing, goats were bleating, and a few birds were chirping. There was a magnitude 4.2 earthquake earlier today around 9:30 PDT and the epicenter was on Brannon Island. We didn’t see any evidence of the earthquake while driving in the area. https://earthquake.usgs.gov/earthquakes/map/?extent=38.00888,-121.79958&extent=38.23009,-121.44253&range=week&listOnlyShown=true&settings=true This was an off-cycle visit to check on the power situation. Last week during the regular site visit, I plugged in the 7700 again (I previously disconnected it to save on power). Today the data still look complete, so I left the 7700 connected. Joe restarted the Canon camera and cleaned the flux sensors. The reservoir was full. The 7500 read: 427ppm CO2, 675mmol/m3, 31.8C, 101.2kPA, 102SS after cleaning The 7700 read: 2.2ppm CH4, 37RSSI -- 84 after cleaning We left around 16:10 PDT. |
1 photos found

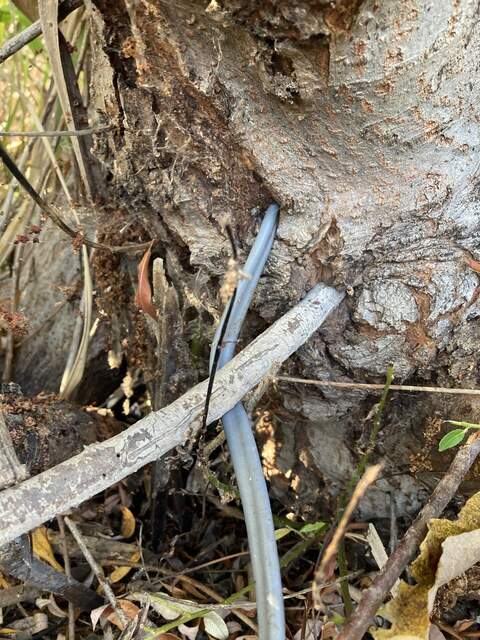
20231018WP_TreeAtePowerLine.jpg ( 2023-10-18 16:01:26 ) Full size: 1440x1920
The willow tree completely enveloped our power line and broke it
8 sets found
Can't check WP_DO
1 WP_DO graphs found
14 WP_met graphs found
5 WP_flux graphs found
Can't check MBWPEESWGT_mixed
Can't check MBEEWPSWEPGT_cam
Can't check MBSWEEWPBCBA
1 WP_processed graphs found
4 WP_arable graphs found

