
Field Notes
<--2023-08-08 12:25:00 | 2023-09-06 11:20:00-->Other sites visited today: Gilbert Tract | West Pond | East End
Phenocam link: Searching...
Mayberry: 2023-08-23 11:30:00 (DOY 235)
Author: Joe Verfaillie
Others: Daphne
Summary: Standard data collection, testing LI-7810 chamber system, fixed tipping bucket cable, moved water level sensor - needs more work, pore water samples
| Mayberry 2023-08-23 Daphne and I arrived at 11:30 PDT. It was sunny hot and humid. The water level was higher than last time. The staff gauge read 28cm. No goats to be seen but still some fencing on other roads. We are testing our new Licor LI-7810 (CO2/CH4/H2O) analyzer and LI-8100 Smart Chamber. The analyzer was already running (sleeping) from the previous site so no lengthy warm up. We tried one spot near the scaffolding on the west side on the boardwalk in shallow water. The fluxes were all over the place probably due to some bubbles. We tried a second spot on the east side of the boardwalk near the tipping bucket on moist soil. I pressed the collar in with my feet. We did five reps at each location. CH4 was in the 10s to thousands of nanomoles and CO2 was about 1-8 micromoles. We were planning on replacing the tipping bucket cable that got snipped on 2023-05-17 and had been repaired with a screw terminal. Turns out there was enough slack to remove the short length near the bucket and reattach it. I added a couple of pieces of aluminum conduit to protect the run up the post. There might be some spurious tips to be cleaned out. Daphne collected the data and cleaned the eddy and radiation sensors. A lot of spiderwebs. She serviced the water sensors, swapping the miniDot desiccant and checking the conductivity port. The 7500 read: 399ppm CO2, 850 mmol/m3 H2O, 31C, 100.6kPa, 93SS – 101 after cleaning The 7700 read: 1.98ppm CH4, 27RSSI – 69 after cleaning. The wash reservoir was 1/3 full – refilled. Daphne disconnected TC9 that has been reading bad. We were hoping to move the water level sensor to a deeper location but it doesn’t have a long enough cable. Its PVC pipe had mud in the bottom so we couldn’t get it back in its original location. We settled for hanging it in slightly deeper water at the northeast of the scaffolding corner where the data logger box is. We tried to keep the reading the same. We should probably buy a new METER water level sensor with a longer cable. The Campbell conductivity sensor seem to be laying on the bottom - moved to hang from the scaffolding. We took soil pore water samples for conductivity: Red, 16.04mS, 31.9C Yellow, 14.55mS, 25.5C Blue, none Green, 10.50mS, 25.8C Bare, 17.25mS, 30.1C Bare, 17.60mS, 30.1C I think this methodology is overly cautious; pulling multiple samples and rinsing syringe and secondary sample tube multiple times. The readings didn’t change very much (bare reps above) and it’s hard to pull samples. By the time you pull a third sample you are probably getting pore water from above and below the sipper depth. We left at about 13:10 PDT. |
1 photos found
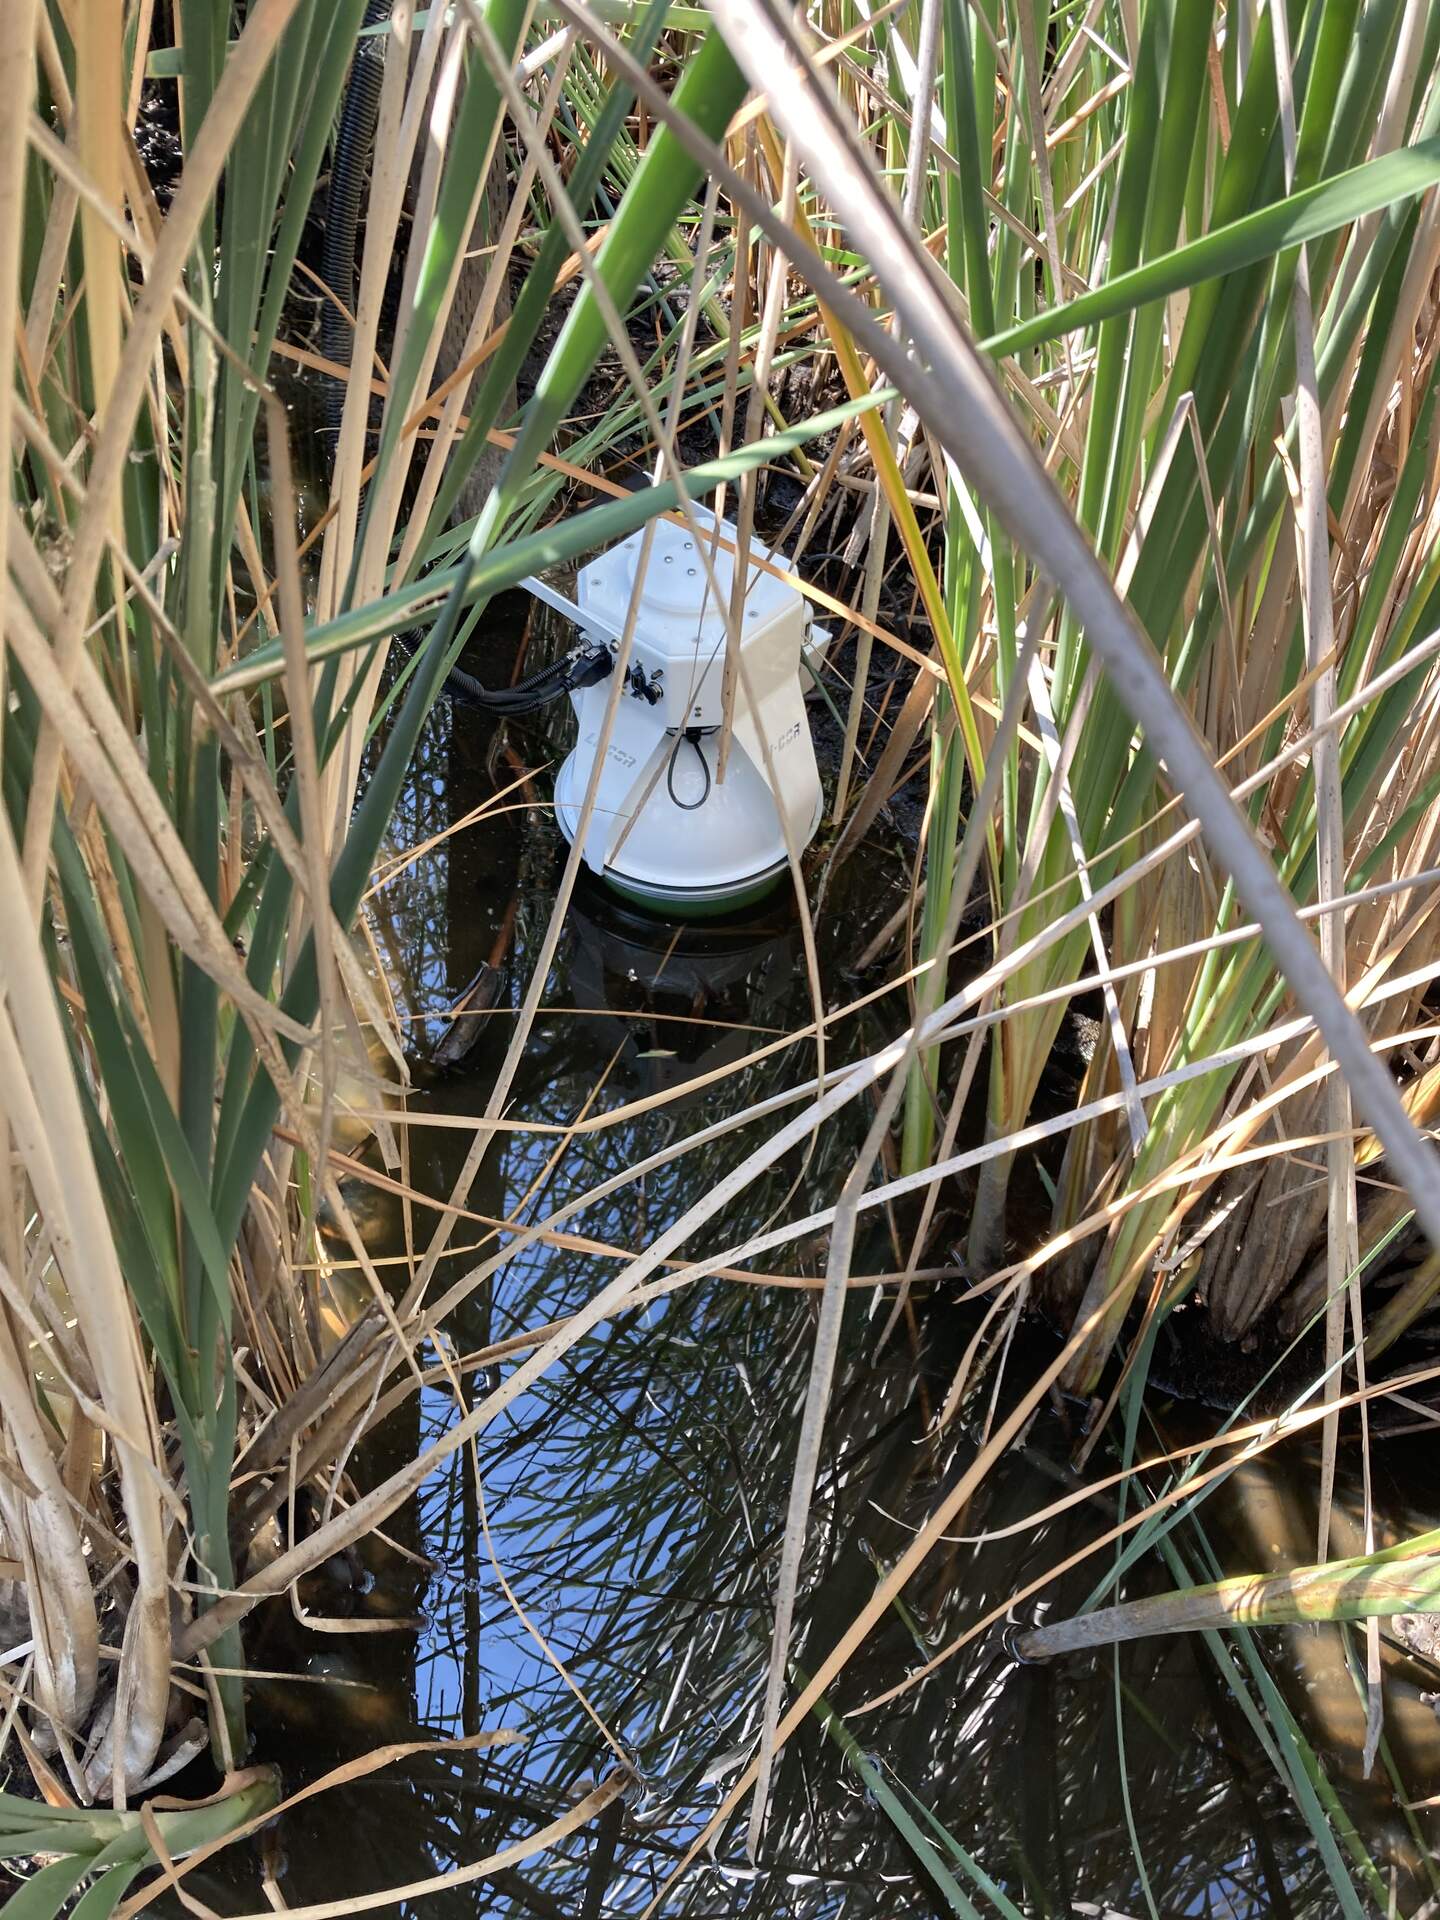
20230823MB_LicorChamber.jpg ( 2023-08-23 11:47:40 ) Full size: 1440x1920
Testing Licor flux chamber
11 sets found
7 MB_flux graphs found
No data found for MB_met.
27 MB_tule graphs found
Can't check MBWPEESWGT_mixed
1 MB_cam graphs found
Can't check MBEEWPSWEPGT_cam
Can't check SIMBTWEE_met
1 MB_minidot graphs found
Can't check MBSWEEWPBCBA
1 MB_processed graphs found
Can't check MB_fd
1 MB_fd graphs found